MGoUFRVisualization

A few weeks ago I decided I wanted to play with some web scraping and RShiny and thought building a toy for the MGoCommunity to be able to look at old players would be a fun project.
I now have the points to actually post a new message and it's all up-to-date, so here it is:
https://mikegros.shinyapps.io/ufr_analysis
I've put the project up on github:
https://github.com/mikegros/ufr_analysis
for anyone to grab and improve. Until I move it to a different host, I'll need to keep the live version updated if anyone makes changes.
Things it can do:
- Make plots of individual players pluses, minuses, and total +/- from the charts of all the UFRs since the end of 2005.
- Look at position group totals as well in the same way as above
- Aggregate numbers to their mean by year for cleaner viewing
- Compare players +/- side-by-side on the same scale
- There is a sortable table for looking at best/worst career/season/game or for looking at the raw data for any players
- RPS/other team metrics can be viewed in the Single Player Tab, their position is "TM" in the Sortable Table if that matters
- Top 10/Bottom 10 lists - quick look at a wall of fame/shame to get context for particularly big or rough games.
- Automatically checks for new UFR data on viewing. Should keep it up to date as long as it's used (probably at least by me) every 4 games or so.
Things to fix:
- Pressure metric for D is missing since 2010 due to a typo in my scraping. I'll fix it at some point but this is a side project for me so timeframe is unknown
- iOS support bug - for some reason there is a resizing issue on iOS devices. No clue why; will try to fix it later
- Possibly change hosting do to some of the restrictions on that current host. I'll assess that based on traffic
Things to add:
-
Panel for Top 10/Bottom 10 lists - I already have the functions to do that and it's easy for anyone to check on their own with the table, but it would still be nice to have a dedicated panel to quickly look at a wall of fame/shame to get context for particularly big or rough games - "Similar players" tool for trying to get an idea for who is grading out similar to players past - good and bad.
- Add ability to adjust for # of plays in a game. Would be even better to adjust for playing time per person, but that might be ambitious.
I've started sharing a few of the plots in UFR threads in order to finally get the mgopoints to be able to post (Been a lurker since forever...). Some examples are below. The x-axis labels should be more legible on the web app:
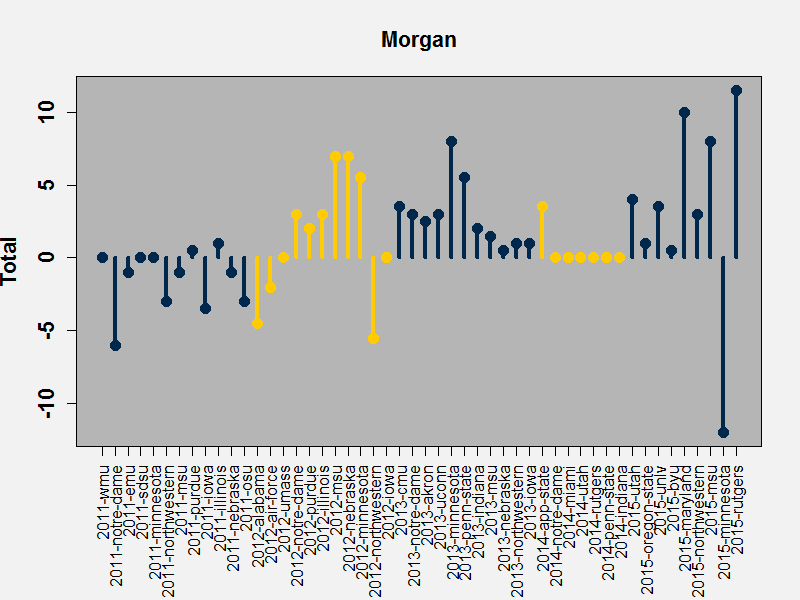

I hope the community likes it, please give feedback! Feel free to "Save Image As..." and share images at your leisure, though obviously I'd appreciate the source being mentioned.
November 12th, 2015 at 4:18 PM ^
This is awesome. Can't wait to play around with it!
November 12th, 2015 at 6:07 PM ^
Sent from MGoBlog HD for iPhone & iPad
November 12th, 2015 at 4:32 PM ^
Noice!
November 12th, 2015 at 4:33 PM ^
Baller
November 12th, 2015 at 4:39 PM ^
is fantastic.
November 12th, 2015 at 5:01 PM ^
Game Blouses
November 12th, 2015 at 5:11 PM ^
This is really cool. Thanks for the work!
November 12th, 2015 at 6:35 PM ^
So, you have a lot of time on your hands. must be nice. Anyways this is pretty cool stuff and thanks for your time!
November 12th, 2015 at 7:06 PM ^
... but I could justify it to myself as "professional development" as it's good to practice web scraping and data cleaning; plus it was a good toy to use for learning RShiny.
It's also just fun data to look at.
November 12th, 2015 at 7:24 PM ^
justify it however you want man, this is awesome.
November 12th, 2015 at 10:35 PM ^
November 13th, 2015 at 7:25 AM ^
But can you port it to ArnoldC?
November 13th, 2015 at 1:20 PM ^
People should remember to upvote his comments so he gets "point cred" for his work. If I remember correctly, OP votes don't count.
November 12th, 2015 at 7:10 PM ^
This is very cool and informative - definitely worth checking out.
(Also, kudos to you for earning your Mgopoints the old-fashioned way, instead of just visiting a posbang thread and getting 100 points in an hour.)
November 12th, 2015 at 10:11 PM ^
If someone has a solid, diary level contribution I think all of the mods are on board with just dumping some points into an account. To be clear this is an exception and people should post normally to acquire the ability to post, but if you're going to bring something unique to the table immediately (like this) comment in the mod sticky or get our attention on the board or tweet LSA and we'll make it happen.
November 12th, 2015 at 11:54 PM ^
November 12th, 2015 at 9:47 PM ^
November 12th, 2015 at 11:40 PM ^
November 13th, 2015 at 12:01 AM ^
November 13th, 2015 at 5:02 AM ^
Fantastic stuff. One question - looking up older players brought mixed resutls. e.g. Lamarr Woodley and Leon Hall have full data for 2006. But Mike Hart has only two games showing up. Are there some gaps in the earlier data?
Thanks a ton for putting this together. Really good!
November 13th, 2015 at 10:47 AM ^
.... chart +/- for offense for a long stretch. He only made the Hennechart and then at some point started the receiver chart before adding the +/-.
November 13th, 2015 at 8:00 AM ^
Seeing this information graphically is wonderful. Performance trends are now so easily digestible. Many thanks!
November 13th, 2015 at 8:03 AM ^
Take a look at Koger vs Butt. You may be surprised.
November 13th, 2015 at 11:09 AM ^
FTW...
November 13th, 2015 at 9:19 PM ^
posted a comment in the frontpage diary thread, but yeah I think there are lots of people that would love to collaborate on this. Any way we can contact grozzy to lobby for this?
November 13th, 2015 at 10:14 PM ^
I responded in the other thread too, but sounds great. I will get on it soon (when I can scrape up the time).
Thanks for the idea!
November 20th, 2015 at 1:14 PM ^
Here: https://github.com/mikegros/ufr_analysis/
Have at it!
November 13th, 2015 at 2:16 PM ^
For the usefulness, yet elegent simplicity of the tool.
Well done.
November 13th, 2015 at 3:18 PM ^
It's awesome to be able to sort the game / season / career numbers for each player.
Lewis looks like he will end up with double the points of anyone else for career points by the end of this year and Peppers looks like he will blow that number out of the water by the end of his! Progress!
November 13th, 2015 at 4:14 PM ^
I pretty much went through and gave everyone who posted a plus one. Even if I banged alone I think your work was worth my effort. Really cool stuff. Thank you.
November 13th, 2015 at 7:42 PM ^
This is the coolest thing since the UFR viewer, may it RIP.
Just for fun I looked at Braden's numbers. As Brian wrote, he just isn't the same player we saw against Utah or in 2014 for that matter. Braden has transitioned from OL most likely to be replaced to pretty damn good. Looking forward to next years numbers. BTW I thought his block on the LB on Pepper's TD was outstanding, maybe worth a +2 IMO.
Thanks!!!!
November 13th, 2015 at 8:39 PM ^
This is awesome!

November 13th, 2015 at 8:42 PM ^
Does anyone want to go back and analyze Woodson's entire career so it can be added to the visualizer? I want to view awesomeness in graphical format.
November 13th, 2015 at 11:48 PM ^
I've been working on some similar stuff using d3js and node. I got a nice scraper working to pull all the player data into firebase. Hopefully I'll have something interesting to show soon.
Here's an example: Michigan Top 20 Rushers by Net Yards
November 14th, 2015 at 12:18 AM ^
Made the type of exception I was talking about above. Took a look at what you've got and I'd encourage you to post a diary with unique numbers and 200 words when you have something interesting to show.
November 14th, 2015 at 2:34 AM ^
I'd love to see more.
November 14th, 2015 at 3:42 PM ^
Grozzy, I've got my code version controlled in git and spent some time dockerizing the node app this week so hopefully I can easily deploy it to a host in the future. Plus it was an excuse to learn more about how docker works.
Perhaps we should connect on github. My github id is twebb. Let me know what your github id is and if I get the repo up there I'll give you access.
Next step is to turn the d3js rushing visualization code into a working page in the node app (currently it's just a scraper) and connect it up to the firebase data.
November 20th, 2015 at 1:13 PM ^
Here: https://github.com/mikegros/ufr_analysis/
I recently "followed" you on github. I don't have a ton of extra time right now, but I would love to connect and really put together some good work as much as I'm able.
Take care!
December 3rd, 2015 at 12:58 AM ^
First Post is Up: Top 200 Rushers Data Visualization
I've added you to the repo so you can see the code. Can't wait to play with all the data I scraped. Took quite a while to get it all in the form that I wanted it. I might try doing something with the Passing stats next.
Comments