Jimmystats: Tales from the Spreadsheets

I will get back on the UFR horse soon, promise, but every January/February I like to grab all of the year's play-by-play data, painstakingly repair the damaged bits, and recreate the information that (other) internet nerds used to. This all goes into those stat boxes I make for HTTV, which I've started working on in earnest the last few weeks.
While I'm at it I thought it might be useful to put together a companion piece to discuss the statistical profile of Michigan and other teams of interest. I also figured I could make it a reference point for those boxes in the future, and also explain some of my decisions.
Feedback is most welcome; I took Stats 404 in college and have been trying to figure out the rest as I go.
Resources:
- College Football Data (CFBD). A good starting point. Free. You can download tons of raw stuff from them, including play-by-play and drive data. A lot of it's in admittedly rough shape, but they've done the hard part of scouring NCAA box scores.
- Football Outsiders. Most stuff free. Home of FEI and its NFL equivalent, DVOA. Fremeau's Efficiency Index is based on drive efficiency.
- 247 Database. Compare against rosters to see who's coming and going.
- Pro Football Focus. Their grading is suspect but they have all kinds of useful snap data.
- Bill Connelly. SP+ rankings remain the most predictive of all fancystats.
Also I did a data dump on Tempo.
[Hit THE JUMP for the deep nerding.]
Defining Garbage Time
Garbage time is what stat-heads call plays where the game state produces abnormal behavior. The twin gods of college football statdom, Brian Fremeau and Bill Connelly, have different ways of calculating it. My own formula is closest to Fremeau's:
- An offensive possession of two plays or fewer that runs out the clock to conclude the first half, or that runs out the clock to conclude the second half with the score tied, and does not result in a turnover, score, or field goal attempt.
- A possession in the second half of a game in which eight times the number of the losing team's remaining possessions plus one is less than the losing team's scoring deficit at the start of the possession.
- An offensive possession of two plays or fewer by the losing team with a score deficit greater than eight points that runs out the clock to conclude the game.
- An offensive possession or non-offensive scoring possession by the winning team leading by eight points or fewer at the start of the possession that runs out the clock to conclude the game.
Basically it's kneel-out drives and blowout hour. I like Fremeau's definition of blowout time because it's easy to calculate from play-by-play data. However it does unfortunately remove some competitive gameplay, because the coaches don't know the results like we do. Say for example that Team A takes a 22-point lead on Team B with 3:20 remaining:
We know that Team B only has one more possession before losing 45-23, credit them for one more, and figure they have time to score 16 points, which is fewer than the 22 they're losing by, ergo we're now in garbage time. But they don't know that. And the defense doesn't know that. And if some guy—let's just say his name is Eyabi Okie—gets a sack on the ensuing third down, that won't go into our sack rate.
Where I differ from the two giants is I've created special garbage categories that can be added or removed as circumstances dictate. This allows me to include some data that would get excised while also removing some circumstantial behavioral data. For example, there's that old canard about how teams that run more win more. The truth is teams run more when they're in a position to win. It's We'll get into this more when I get to Adjusted Run Rate further down.
PFF doesn't remove garbage time so anything herein based on their data is going to be a little muddier.
Personnel Boxes
 |
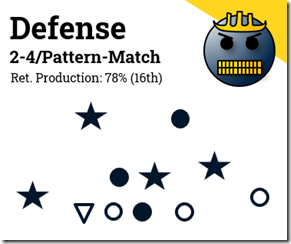 |
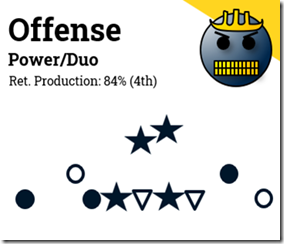
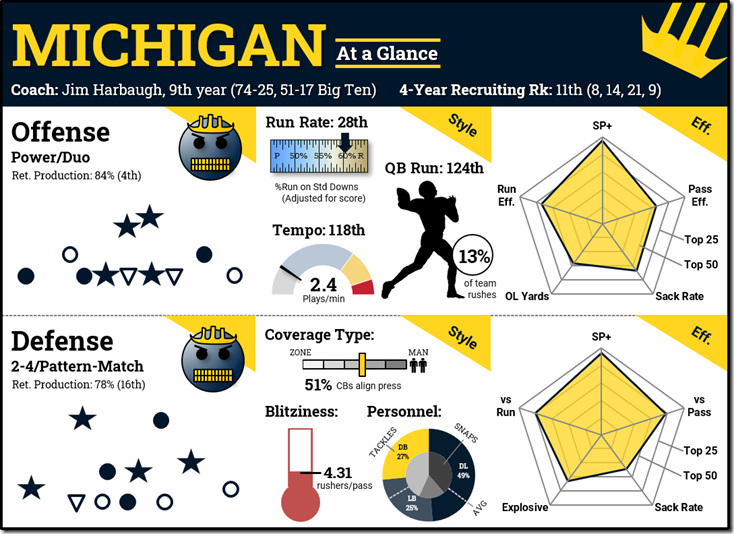
These are meant to give you a quick glance of who's out there.
I give a summary of their style (e.g. Michigan's offense stems most of what they do off of Power and Duo runs). Returning Production is from Bill Connelly. He changes the formula every year so it's best to just trust him. It's year to year *production* not overall roster turnover, so Bowling Green, which gets back several 2021 starters who were injured in 2022, isn't as fairly represented.
The majority of the box shows their most regular (or representative) formation in a heavily simplified version of my weekly charts. A filled in circle ![]() means there's a returning starter (not necessarily from last year). A star
means there's a returning starter (not necessarily from last year). A star ![]() means the guy is expected to be 1st or 2nd team all-conference, so yeah, a player who's good for the AAC might not start for Michigan. A
means the guy is expected to be 1st or 2nd team all-conference, so yeah, a player who's good for the AAC might not start for Michigan. A ![]() means they're expected to start a transfer in that spot. I have JJ, Corum (and Edwards), Zinter, and Keegan as stars, and LaDarius Henderson (LT) and Drake Nugent (C) the transfers starting. I went back and forth on Roman Wilson (at slot receiver) because I think he's star caliber, but don't know if he'll get enough targets to be 1st team all-conference. YMMV. The cutoff for "starter" is he either seized the role after playing evenly with others (e.g. Will Johnson), or he's started at least five games in his career.
means they're expected to start a transfer in that spot. I have JJ, Corum (and Edwards), Zinter, and Keegan as stars, and LaDarius Henderson (LT) and Drake Nugent (C) the transfers starting. I went back and forth on Roman Wilson (at slot receiver) because I think he's star caliber, but don't know if he'll get enough targets to be 1st team all-conference. YMMV. The cutoff for "starter" is he either seized the role after playing evenly with others (e.g. Will Johnson), or he's started at least five games in his career.
Finally the faces are an HTTV tradition, repurposed from the old recruiting board.
| Sad Josh | Memo | Data | Angry Eduardo |
|---|---|---|---|
 |
 |
 |
 or or  |
| Bad. | Mediocre. | Fine. | Top-10. |
I change Eduardo into Mr. Blue on Michigan's box only.
Style Boxes
Here's where we get into the choices these teams make. Not all the data were easy to come by, but hopefully they're pretty straightforward.
Adjusted Standard Down Run Rate
is how often a team runs the ball, adjusted for game state, on standard downs (sacks counted as passes). Standard downs are defined as anything that's not 2nd & 7+ or 3rd/4th & 5+. Obviously, teams run more often on standard downs. Here's last year:
| Dwn Type | Runs | Passes | Run% |
|---|---|---|---|
| Standard | 44,632 | 33,759 | 57% |
| Passing | 11,133 | 22,764 | 33% |
The game state is a big deal too. Even after I remove Fremeau's definition of garbage time, you can see a huge difference in how teams play when they're up versus down. The data that make up this graph are all from competitive situations:
The curve is gradual but by their last three possessions you can see teams really changing their strategies. Even a tied team going for a walk-off field goal will run more often than your average team down a touchdown or more in the 4th quarter. Breaking these down I could identify five game states.
- Two-Minute Drill (40% standard down run rate). Plays within two minutes of the end of the 1st half, or plays on the offense's final drive when they are tied or losing by 3 or less. This encompasses about 6% of plays last year.
- Comeback Mode (34%). The offense needs a TD on their last drive, or is down by two scores on their penultimate drive, or are down by three scores on their 3rd to last drive, but not yet in garbage time. This was about 4% of plays.
- Give-Up Mode (49%). Losing in garbage time. About 3% of plays.
- Lead Late (82%). The offense has a lead on their final drive, or they lead by 2+ scores on their penultimate drive, or they lead by 3+ scores on their 3rd to last drive. It seems to be the same behavior whether it's garbage time or not. About 7% of plays.
- Standard (57% run). The other 79% of plays.
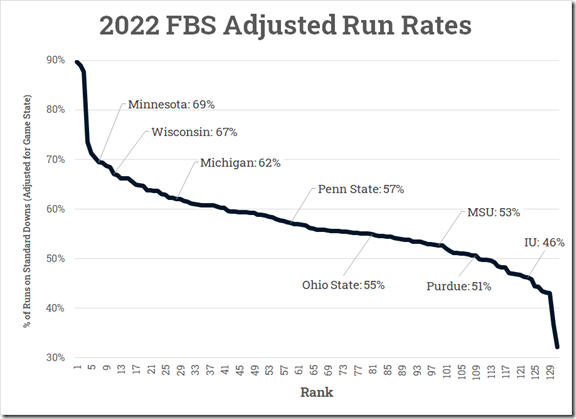
Knowing the number of snaps each team had, we can compare them to the run% an average team would have had in those circumstances. Michigan was seventh in the country at staying out of passing downs, and second only to Georgia in getting to blowout hour, so our adjustment is a pretty big one, dropping from 17th in raw rushing rate to 28th once I make the adjustments. They're runny, but they're on the gentle slope.
Michigan's a very run-oriented team but not to the degree of some in the Big Ten. Minnesota was one of the runningest teams outside of the service academies, and IU was right on the edge of the Air Raids. Wazzu (37%) and Mississippi State (32%) were the two passy extremes; RIP Mike Leach.
I was surprised by Ohio State because Ryan Day's reputation is pass-first. The difference: OSU was just a 70% run team when holding a big lead late and a 71% run team on 3rd/4th down and short (2 yards or fewer), where 92% is average. Only Purdue among Big Ten teams had less trust in their running game.
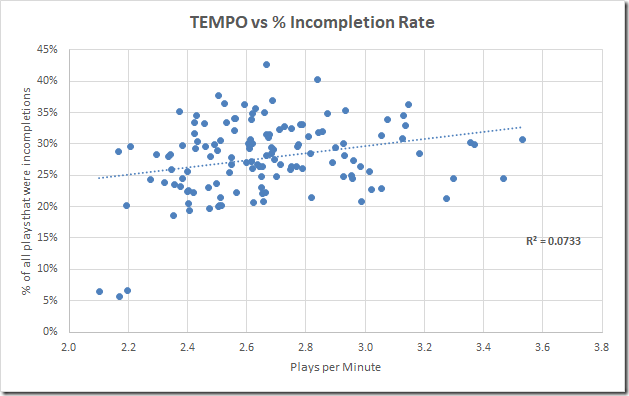
Tempo
This was a bitch to calculate because few teams follow the guidelines of what's a play, when to clock it, etc., and I had to do it myself. I tried to do it with play-by-play data first but it wasn't worth the time to find all the data the schools didn't report. Most have fairly accurate drive data, and my play-by-play data is more useful than normal when it comes to knowing what was a kickoff or a punt. I added a column for each game with the number of scores plus the number of punts and plotted it against the drive data to figure out really quickly which teams reported what as plays.
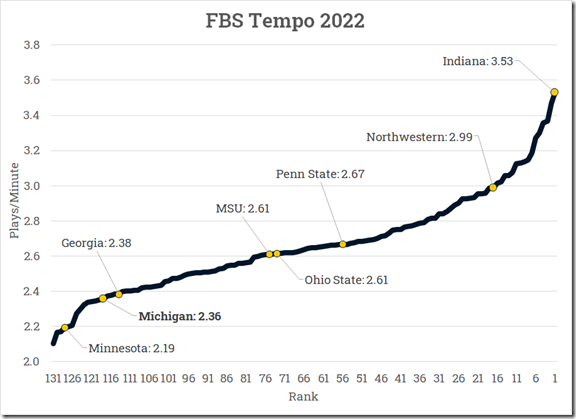
SO, what did I find after this? A lot of average teams with a few that use tempo as a weapon and a few very slow ones, but more of a curve than I was expecting.
When I posted the data dump of these some readers suggested ways of adjusting it further for incompletions. I tried that but the effect was so small it wasn't worthwhile
R-squared = waste of time.
What I would like to do, but don't have the time for now, is increase the adjustment for leading late the same way I did with the run rates. My guess is Fremeau's definition of Garbage Time leaves in a lot of drives when the winning team is trying to kill clock (e.g. when they're up by 15 with about 3:20 left).
QB Run
Was a relative breeze. It's the percent of rushes accounted for by the quarterback. This does not include sacks, but it does include scrambles, which means teams that pass a ton end up getting super high rates of QB rushing. The fix for this is to adjust for pass rate, obviously. But I haven't gotten around to it yet, so right now I just have the raw.
I did a cool thing though. Depending on the style of the quarterback the silhouette changes. You can guess which QB of my lifetime that each was drawn from.
Coverage Type
Pro Football Focus only makes some of its data downloadable to do with as you like. I took the data they had on cornerbacks playing press versus off coverage to give us an estimate of how often each team runs zone versus man coverage concepts. It's not exact of course, but it's a good indicator as a slider.
Illinois was #1 in the country as far as choosing man defense, and Penn State was 13th. Michigan was 21st, in a tight group with Nebraska and Ohio State. The Big Ten West had a ton of zone teams: Purdue (107th), Iowa (109th), Minnesota (110th) and Wisconsin (114th), which passes the sanity test.
Blitziness
Get it? Bring the heat!
Another stat from PFF, based on individual players given pass rush grades. They break them up by position too but a simple thermometer for bringing the heat seemed to do the best job of demonstrating each team's "Bring."
Unfortunately they don't adjust this situationally, or at least not in the base numbers they publish. There is a difference between passing downs and standard downs for different teams but that's much harder to calculate without advanced stats so I stuck to what PFF provides.
Eastern Michigan(!!) was a blitziest team in America. Wisconsin (3rd nationally) and Iowa (10th), who brings LBs all the time even if both safeties are always back, led the Big Ten, followed by Indiana (17th) and Penn State (21st). Michigan (98th) was near the bottom, behind only rushes-three Nebraska. If this surprises you about Minter's Amoeba stuff it shouldn't—Michigan mostly zone blitzes, meaning they drop someone else into coverage to create weird looks while still rushing four.
Personnel
Here's the little jerk that kept me up till 3 a.m. last night. I've been playing around with ways to show who's out there, but defenses are getting more homogenous in personnel. Who's making the tackles is actually where things deviate.
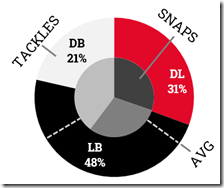
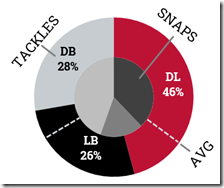
The inner ring is participation data from PFF; the outer ring is tackling data from CFBStats. League average would be a tackling distribution of 35% linemen, 32% linebackers, and 34% defensive backs (roughly thirds), and personnel distribution of 36% DLs, 20% LBs, and 43% DBs, which equates to 4 DL, 2.2 LBs and 4.8 DBs. I'd like to figure out a way to identify what average is on this graph so you can see how much each team deviates.
It's the deviations from those averages that tells you things about how those defenses work. The difference between DTs and LBs should tell you whether they're having the DTs soak up doubles while the LBs flow to the ball, or if they're (like Michigan) depending on their heavies to fend off blocks and make stops.
Michigan is an extreme defensive line team, getting nearly twice as many tackles up front as a normal team would. They play a few more DTs than average, but they try to jam up everything at the line of scrimmage, allowing the secondary to focus more on coverage and clean up big mistakes.
We can look at some other teams with system defenses to get an idea of what they look like on the graph.
| 404 Title/Pattern Match (TCU) |
3-3-5 Cover 2 (Cincinnati) |
Quarters 4-2-5 (San Diego State) |
 |
 |
 |
TCU is the polar opposite of Michigan. They roll down multiple DBs as run defenders, and mostly ask their DTs to soak up blocks to keep the LBs clean while they hunt for tackles. Cincinnati plays its secondary the same way as Michigan's but their front functions like TCU's, with three space-eating DL and LBs flying around to the ball. Brady Hoke's SDSU defense would like Michigan's front—they're both heavily influenced by the Ravens of course—but relies on safeties to flash down into the box more often (you remember this, right?) to take some stress off of the linebackers.
All these approaches work, but good teams do generally tend to shift work up front. Alabama runs a 3-4/Pattern-Match system that should come out looking like TCU, but their DL are able to generate TFLs at such a high rate that it actually shifts a hefty portion of the action towards them. However, the SEC and Big Ten are runnier leagues than the Big XII; Iowa State (6th in SP+) looks almost exactly like TCU (52nd). To compare systemic apples it's not just about finding relative peers in talent and performance, but relatively similar schedules.
| 3-4/Pattern-Match (Alabama: 11th in SP+) |
3-3-5/Cover 2 (Ohio State: Gave up 45 to UM) |
3-4/Cover 2 (Georgia: 3rd in SP+) |
 |
 |
 |
The bad news for HTTV is after all of this Michigan doesn't actually face many teams like themselves that are all that interesting from a system perspective. Maryland and ECU are really the only oddballs on the schedule, though Bowling Green has something like Michigan's Ravens approach. The two teams that profile the most like Michigan are Illinois and Georgia, FWIW.
Let's move on to the last two boxes.
Mr. Coffee
Like I said, I was up in my spreadsheets past 3 a.m., and because there are two small people suffering through Brian Cook's stomach ailment right now, I'm not able to simply shift my awake hours to compensate like certain Alex Drains. The solution isn't a perfect one, but I managed to infuse a mix of oxygen hydroxide with tannin, fixed oil, carbohydrates, proteins, and a salt of chlorogenic acid. There's lots of churning and bubbling.
You may want to get some as well. I know there's already been a lot of math, but we're about to enter ludicrous math.
….
Got it? Okay now we're ready to watch…
Mr. Radar
Every year I obsess over what the five points are going to be. Sometimes one or both units got multiple radars. The reason for a radar graph on these is I want to be able to show you very quickly how good they were last year. The more area inside the pentagon that's covered, the better the unit. I also have the guides set at increments of 25 so you can see how close they are to being a Top-25, Top-50, Top-100, etc. team in each metric.
While system choices go into these factors, unlike the personality ones from the previous section, these are all very much about efficiency. They also help to identify areas of strength and weakness.
SP+
is Bill Connelly's go-to all-everything efficiency stat. Gamblers love it because of all the single numbers generated it's the most predictive of future events. Its formula is a closely guarded secret, except it starts with play-by-play data. Its basic premise is every play contributes a certain value (much like the expected points I track in UFR), but then it gets weighted by all sorts of factors. If his preseason SP+ is out in time I'll substitute last year's.
Run Eff., Pass Eff., vs Run, and vs Pass
The Run/Pass Efficiency metrics were going to be another great big Seth Calc but CFBD went and published them. Just go to Advanced Team Metrics and pop in a season. There's even a little button to exclude Garbage Time, which I have.
The actual metric here is PPA (Predicted Points Added), which is the same thing as EPA (Expected Points Added), or PPP (equivalent Points Per Play) a play-by-play efficiency stat that credits you for incremental changes in game state as a measure of points.
If you're unfamiliar with EPA, at each down and distance and field position we know how many points an average team is likely to score on that drive. This could be negative if the likely result is a punt that sets up the opponent in good field position. Then you take the new game state after the play and subtract the first game state from it and voila: a point score for the play.
Let's do an example play. Play ID 4014053264 is a 3rd and 3 from the offense's 15 yard line. The expected points in that game state is -0.0128870826080653. Here's what happens:
A TD is worth 7 points (or close to it—there's some weirdness because of misses and 2PAs but we just use 7). That gives Play #4014053264 a PPA of about 7.01.
Let's compare it to a play three spots earlier in the database, #401405153242. That one was a 1st and 10 from the offense's 25, which has an EP value of 0.922244880278678.
Also worth 7 points. So 7 minus the original EP value is 6.08. Both are huge plays, but EPA isn't a clutch metric that measures win%. It's a points metric that measures how much you changed the outlook for the drive.
Everybody got that?
OL Yards
is a Football Outsiders statistic that credits the offensive line for the first few yards of a rushing play, and diminishing returns until they get to 8 yards, at which point they figure the OL has done its work. It's not perfect; OL yards can get thrown off badly by defensive approaches. For example, if a defense is playing with zero safeties and throwing a bunch of dudes at the line of scrimmage, the offensive line is going to get tagged for getting overwhelmed. If they do manage to break through all of those bodies and send the running back into open space, like, oh, in this example…
…then the OL only gets full credit for three yards, and partial credit for the next five. For this reason it can be an interesting metric for defenses, since it shows how much material they're committing to the front. But I came down on using it on offense because there was an explosive stat I wanted for defense.
Explosiveness
is a measure of how dangerous your successful plays were. Bill C used to produce a neat, well-adjusted version called IsoPPP+, but it's not that hard to recreate this from play-by-play data. You know what EPA is already. This is just EPA on successful plays.
What's a Successful Play? It's a play where the offense accomplished what statisticians have determined are the general goal of any given down. I use CFPD's definition:
Success Rate is an efficiency metric that determines the success of a play. Successful plays meet one of the following criteria:
- the offense scored
- 1st downs which gain at least 50% of the yards to go
- 2nd downs which gain at least 70% of the yards to go
- 3rd and 4th downs which gain at least 100% of the yards to go
This is the basis of Fremeau's FEI. Success Rate is interesting because it tells you how much a team is staying on track. It's intuitively a great stat but I don't use it much because Michigan lives in an extreme environment. That is, Michigan is usually the #1 or at least #2 biggest game on every opponent's schedule, which means they routinely get abnormal defensive approaches that play havoc with success rate. Both Ohio State and Illinois kicked Michigan's butt in Success Rate last year, but one of those teams gave up 45 points. It's a lot like using Corsi (even-strength shots on goal) in hockey, in that it's a great stat in general, but breaks when talking about a Penn State that shoots every chance they get, or when a team with a lead is limiting their shots to keep possession, or when a team has pulled their goalie for a long stretch. I've often likened Ohio State's decision to play without a safety last year to pulling the goalie.
Anyway: Explosiveness gets affected by this too, but it's got a built-in regulator for different approaches because non-explosive teams tend to not be able to cash in against aggressive approaches, and vice versa. Explosive teams tend to have backs like Edwards who routinely convert open plays into TDs. They also might have receivers who are great jump-ballers. And when you're measuring explosiveness you're not concerned with down to down efficiency. You just want to know how much they're grasping, because the other metrics are already telling you how often they're connecting.
It's even better on defense, because it tells you what choices that defense is making. Granted, Ohio State isn't going to metaphorically pull the goalie against everyone. But they did have guys in the secondary routinely blowing deep concepts like Mills:
…and as a result were 95th in defensive explosiveness last year, last in the Big Ten. Here's a big table of Big Ten explosiveness:
| OFFENSE | DEFENSE | |||||||||||
|---|---|---|---|---|---|---|---|---|---|---|---|---|
| Rk | School | Off Exp | Nat Rk | vs Run | vs Pass | Rk | School | Def Exp | Nat Rk | vs Run | vs Pass | |
| 1 | Penn State | 1.393 | 17 | 5 | 59 | 1 | Iowa | 1.028 | 8 | 2 | 6 | |
| 2 | Maryland | 1.305 | 52 | 51 | 74 | 2 | Northwestern | 1.079 | 19 | 32 | 3 | |
| 3 | Michigan State | 1.300 | 55 | 81 | 81 | 3 | Nebraska | 1.123 | 29 | 18 | 24 | |
| 4 | Ohio State | 1.280 | 66 | 85 | 60 | 4 | Maryland | 1.163 | 37 | 41 | 9 | |
| 5 | Nebraska | 1.265 | 78 | 114 | 34 | 5 | Rutgers | 1.171 | 39 | 25 | 30 | |
| 6 | Michigan | 1.228 | 90 | 46 | 82 | 6 | Michigan | 1.193 | 44 | 16 | 18 | |
| 7 | Wisconsin | 1.220 | 95 | 82 | 36 | 7 | Indiana | 1.200 | 45 | 10 | 39 | |
| 8 | Indiana | 1.205 | 100 | 35 | 129 | 8 | Wisconsin | 1.230 | 52 | 12 | 55 | |
| 9 | Iowa | 1.149 | 117 | 120 | 110 | 9 | Minnesota | 1.248 | 55 | 71 | 36 | |
| 10 | Rutgers | 1.128 | 124 | 131 | 29 | 10 | Michigan State | 1.273 | 61 | 59 | 78 | |
| 11 | Purdue | 1.120 | 126 | 129 | 120 | 11 | Purdue | 1.277 | 62 | 37 | 88 | |
| 12 | Northwestern | 1.108 | 128 | 116 | 122 | 12 | Penn State | 1.285 | 64 | 70 | 48 | |
| 13 | Minnesota | 1.102 | 129 | 103 | 108 | 13 | Illinois | 1.288 | 64 | 111 | 17 | |
| 14 | Illinois | 1.092 | 130 | 117 | 123 | 14 | Ohio State | 1.432 | 95 | 114 | 117 | |
Michigan's numbers won't surprise you, but they show why I wanted to have this in the defensive radar graph. Breaking it into run/pass really illuminates defensive intentions. There are good defenses that take a lot of risks in Penn State, Illinois, and Ohio State, and good defenses that take very little risks, and bad defenses that are bad because they give up huge plays, and bad defenses that get churned down the field. Having this in context paints a vivid picture of the type of team you're facing.
You may find it odd that Ohio State's passing offense ranked so low. This is unfortunately unadjusted, which means Big XII teams look like they're all playing with fireworks while the Big Ten comes off as efficiency engineers. The big exceptions are the schools that really allowed their quarterbacks to chuck it. Ryan Day's system is way more about efficiency than people realize—they chew you up NFL-style because there's no way to get leverage on every single NFL-bound receiver. The most explosive thing in the Big Ten last year wasn't CJ Stroud unleashing the dragon; it was Sean Clifford breaking the pocket.
But good lort, Big Ten West.
Adjusted Sack Rate
This too I tried to calculate on my own. Unfortunately sacks are rare events so we can't trust more than broad assertions. The effects of down and distance however are quite easy to spot.
These are raw sack rates, garbage time removed, for all 2022 games, minimum 200 downs. I think there's enough here to justify 3 boxes:
- Standard Downs: 1st down, 2nd & 6-, 3rd & 3-
- Passing Downs: 2nd & 7-10, 3rd & 4-5
- Super Passing Downs: 2nd & 11+, 3rd & 6+
The third category is for when you absolutely have to pass, to differentiate the situations when sack rates climb into the double digits from those that are merely more than double the rate of standard downs. Sack rates (% of passing plays that result in sacks), unsurprisingly, correlated strongly with down to down passing rates.
Fourth down has slightly higher sack rates because QBs aren't as willing to get rid of it and punt, but there isn't a lot of sample size to break it out. There's also a blip on 2nd & 1 because defenses expect the offense to use the free down for a longshot, and because those are slower to develop.
Anyway I used the pass rates for my sack rate adjustment. I also adjusted for opponents, adding a column to each passing play with the opponent's down & distance-adjusted sack rate (using 4.04% for FCS opponents, which is what they averaged together). The Big Ten wasn't actually that strong of a pass-rush conference so the schools you care about weren't affected much. Here's how we made out:
| OFFENSE | DEFENSE | |||||||||
|---|---|---|---|---|---|---|---|---|---|---|
| Rk | School | Raw | ADJ Sack Rate | Nat Rk | Rk | School | Raw | ADJ Sack Rate | Nat Rk | |
| 1 | Ohio State | 0.028 | 0.027 | 7 | 1 | Ohio State | 0.086 | 0.087 | 10 | |
| 2 | Michigan State | 0.04 | 0.036 | 21 | 2 | Penn State | 0.079 | 0.083 | 16 | |
| 3 | Northwestern | 0.043 | 0.041 | 30 | 3 | Wisconsin | 0.076 | 0.081 | 18 | |
| 4 | Penn State | 0.047 | 0.042 | 33 | 4 | Iowa | 0.067 | 0.072 | 30 | |
| 5 | Michigan | 0.044 | 0.047 | 37 | 5 | Michigan | 0.077 | 0.069 | 36 | |
| 6 | Minnesota | 0.051 | 0.051 | 47 | 6 | Maryland | 0.055 | 0.064 | 54 | |
| 7 | Rutgers | 0.058 | 0.052 | 50 | 7 | Michigan State | 0.07 | 0.063 | 56 | |
| 8 | Purdue | 0.049 | 0.053 | 53 | 8 | Illinois | 0.061 | 0.062 | 64 | |
| 9 | Illinois | 0.065 | 0.06 | 70 | 9 | Purdue | 0.061 | 0.056 | 86 | |
| 10 | Indiana | 0.067 | 0.064 | 77 | 10 | Northwestern | 0.057 | 0.053 | 95 | |
| 11 | Wisconsin | 0.076 | 0.073 | 98 | 11 | Nebraska | 0.046 | 0.049 | 105 | |
| 12 | Nebraska | 0.076 | 0.083 | 114 | 12 | Rutgers | 0.044 | 0.045 | 115 | |
| 13 | Maryland | 0.093 | 0.092 | 123 | 13 | Minnesota | 0.044 | 0.045 | 118 | |
| 14 | Iowa | 0.099 | 0.1 | 128 | 14 | Indiana | 0.04 | 0.044 | 119 | |
Eh.
Michigan's Statistical Profile
So what does this all mean? A lot of it should come as no surprise to anyone who reads this site. Michigan returns most of their Power/Duo offense
including stars in the backfield and at both guard spots, with a couple of OL transfers joining an experienced group.
…under a very good coach who has recruited at a B+/A- level. They take their time…
…to get everyone on the same play and check the defense before the snap. They also try to avoid running with their QBs.
Running as much as they do seems to have worked—if anything they maybe should have run more, since their rush efficiency remains very high. That has something to do with their sack rate, which is too high for a team with this much going for it.
Also the "OL Yards" metric might be a sign that the RBs are doing a lot of the heavy lifting, but more likely that opponents are jamming the box against them.
Defensively they're also returning a ton of production…
…with a lot of young stars in the secondary. However, when you look at their usage distribution they're a HEAVY defensive line team, so replacing three starters up front is probably going to matter more to them than replacing a starting cornerback.
That secondary does have a lot on its plate, however.
They're asked to be both a zone and a man team, which probably means they're changing up coverages a lot. They also have to last awhile, though with more help, because they don't bring a lot of pressure.
It's working, but it could be better.
They're a little leaky in giving up explosive runs. Drilling down it's runs to QBs causing a lot of those explosives, which might be an effect of their pass rush style). They're also not getting to the quarterback. Adding some natural pass rush to their front would be huge, since it's the one big missing ingredient in an otherwise elite unit.
February 22nd, 2023 at 2:01 PM ^
Based on all this data it's pretty easy to conclude that Seth is way smarter than me and I like watching Donovan Edwards highlights.
February 22nd, 2023 at 10:28 PM ^
Echo this. Thanks Seth.
February 22nd, 2023 at 2:04 PM ^
My strictly UM-centric silhouette guess:
Navarre, Forcier, Shoelace?
February 22nd, 2023 at 2:39 PM ^
Fastest one is obviously Denard, but middle one is trickier. Maybe Shea Patterson?
February 22nd, 2023 at 2:51 PM ^
Think it's Harbaugh
February 22nd, 2023 at 2:52 PM ^
Nah, it's not lol
February 22nd, 2023 at 10:29 PM ^
I think he's actually a good example.
February 22nd, 2023 at 9:51 PM ^
Brady, Henson, Denard.
February 22nd, 2023 at 2:18 PM ^
Just reporting that I watched each embedded video every time it was embedded.
February 22nd, 2023 at 2:19 PM ^
I got a C in stats 100
my head exploded after the second paragraph.
God bless Seth and the insane amount of work he puts in.
February 22nd, 2023 at 2:45 PM ^
I need a nap after reading and digesting all that. At least it's a good day for it.
Thanks Seth!
February 22nd, 2023 at 2:53 PM ^
So, to conclude, we're pretty good and balanced and have a pretty good team and pretty good chance to repeat the success from last year? Asking for a friend
February 22nd, 2023 at 3:11 PM ^
Please tell me this won't be on the test.
February 22nd, 2023 at 3:18 PM ^
So Donovan, about that long touchdown run.
Which one?
February 22nd, 2023 at 3:21 PM ^
Thanks so much, Seth! This was my favorite MGoBlog post in a long time.
I'm curious why you chose to include sack rate in the radar. Wouldn't a metric that includes throwaways be more representative of the strength of a passing attack/pass rush? Obviously, sacks are more influential than throwaways, but a throwaway is still a negative play for the offense and a positive play for the defense (basically, a zero yard sack that stops the clock).
There are also some quarterbacks/offenses who will benefit on the radar from having suspiciously low sack rates. Indiana's Connor Bazelak is a good example. Last year, on his 453 drop backs, he was sacked 23 times (that's a 5.1% sack rate). However, he also led the Big Ten with 30 throwaways. If you add those in, they account for 11.7% of his drop backs.
Meanwhile, Illinois' Tommy DeVito's sack rate was higher than Bazelak's (375 drop backs, 21 sacks, 5.6%), but he only threw the ball away 10 times. Thus, he threw it away because of pressure or was sacked because of pressure on 8.3% of his drop backs. That's significantly better than Bazelak's number, and I'd imagine most would agree that Illinois' passing game/protection was better than Indiana's.
(I'm not sure why I chose DeVito, but you can make a similar case by substituting in Nebraska's Casey Thompson here, too.)
You could also simply just look at pressures per drop back (Bazelak is at 34.0%, DeVito is at 22.9%), but that neglects the fact that some QBs can stand in the pocket and deliver a strike regardless of the pressure, some QBs can leave the pocket and pick up yards on the ground, and some wilt beneath it.
Either way, just curious to hear your reasoning here. Thanks for the post!
(All stats from PFF.)
February 22nd, 2023 at 3:37 PM ^
Wait, am I reading that correctly that we run our QB almost as infrequently as any team in the country? (124th out of 130 something?)
That's just...man. It was clear why we only scored 6 points in the first half against TCU's terrible defense but...man. It's than I would have imagined.
We have a good running QB! Also, QB sneaks are pretty much automatic!
February 22nd, 2023 at 10:31 PM ^
We played a large portion of 2022 with only one healthy, viable QB. And we managed to get him through the season.
February 23rd, 2023 at 3:52 PM ^
Stats show that QBs are significantly more likely (on a per play rate) to get hurt dropping back than running.
This "don't run the QB to protect him" thing just isn't supported by data.
February 22nd, 2023 at 3:42 PM ^
I know it's your livelihood but still...incredible labor of love and technical devotion to Michigan football!
February 24th, 2023 at 7:39 AM ^
Sometimes when I'm listening to the MGoPodcast or watching the weekly WTKA MGoBlog hour on YouTube I think to myself, "Man, Seth is sooo lucky. Dude is actually getting paid to sit around and talk about Michigan football. I wish I could have that gig." And then I come check out the blog and see something like this and realize (a) there is no way in hell that I could come close to doing Seth's job and (b) regardless of how much he is getting paid, the luck one is Brian (and the rest of us).
February 22nd, 2023 at 3:47 PM ^
Seth, this is an incredible post. Thank you for all the hard / insane amount of work you so clearly put into it!
February 22nd, 2023 at 5:07 PM ^
Top notch, Seth. I salute you.

February 22nd, 2023 at 7:00 PM ^
I was told there would be no math
February 22nd, 2023 at 11:02 PM ^
Recruiting should be in top 5 average, need to improve
February 23rd, 2023 at 12:59 AM ^
Great stuff Seth but all I want to know (likely covered but I missed it) is how TCU shut down our running attack in the first half (aside from the first play), and what adjustments would we make this year if we were confronted by a similar opponent defensive approach, that did seem to work quite well.
February 23rd, 2023 at 1:40 PM ^

But just a little chemistry -- the water, a covalently bonded compound, in your Mr. Coffee is "dihydrogen monoxide". Though, it looks like even the main naming body (IUPAC) can't get its act together about water -- throwing in "oxidane" as a possible (no one is calling it that) -- and so they will probably throw their hands up at some point and just accept "water".
February 23rd, 2023 at 2:57 PM ^
You mentioned whom you predicted would be Stars on offense JJ, Corum & Edwards, Zinter, and Keegan, but unless I'm an idiot and missed it, you didn't mention whom you thought were stars on defense.
Can I assume Johnson, Jenkins, Moore and Colson?
February 24th, 2023 at 1:11 PM ^
From the graphic, it looks like the stars were handed out to a LB (Colson), a CB (Johnson), a nickel (Sainristl), and a safety (Moore). Looks like Jenkins is just a filled in circle (returning starter).







Comments