Thanks to Michigan, the Big Ten only kind of really sucks at March Madness

Hello, it's me again. Yes, I know I'm responsible for the uplifting post "The Big Ten Sucks at Winning Championships" https://www.mgoblog.com/mgoboard/big-ten-sucks-winning-championships
I'm back for more. Like a dog with a good bone, that one awesome ex, a favorite pair of jeans, I just can't let this one go. It's been gnawing at me. For years it has bothered me that my perception of the Big Ten in the basketball tournament is "welp, this sucks...again". But I didn't want a simple hot take. No, I'm too data driven and OCD for that.
I present to you....a completely arbitrary yet data driven analysis to understand just how bad the Big Ten is when it comes to March Madness. And why we can all, as Michigan fans, point at the rest of the Big Ten and say, "You really suck!!!" Enjoy.
The background (how I do the data stuff)
The first challenge was creating an arbitrary, yet fair, way of measuring tournament success (or lack there of) value. I actually trend towards being an optimist, so I like to reward success more than punish failure.
For each regional bracket, I listed the conference the team was from. For seeds 1 - 16 I created a summary value. Seeds 1 - 4 were rated 1's, 5 - 8, 2's. 9 - 12, 3's, and 12 - 16 4's. This creates a more balanced, yet weighted scale to measure the impact of seeding.
I then rated each round of the tournament on a simple scale. Round of 64 (I'm old school, I don't count the play in crap). wins are worth 1, Round of 32 are worth 2, Sweet 16 are worth 3, and so forth until a team wins the Championship game which has a value of 6.
Losses are worth -1. It doesn't matter when it happens or to whom. A loss is a loss, and a high seed losing early (cough, MSU vs. Middle Tennessee St.) really does hurt the conference by missing out on the expected positive points. No need to be more punitive.
Now it's simple, for every win, Take the teams seeding value (1,2,3,4) times the round value (1,2,3,4,5,6), count each loss as a -1 and it all looks like this:
2022 Midwest Region (i.e. Kansas winning the Championship this year)

You can see, a 1 seed winning it all equates to 21 total points. They did what a 1 seed is supposed to do. No extra bonus points needed. You can see in this example how painful it is for a high seed (in this case Auburn as the 2 seed) to lose early. They simply don't earn the points a 2 seed should. You can also see the value a lower seed has in going further than expected. In this case, the 10 seed was Miami who made it to the Elite 8.
What does it look like when a true Cinderella makes a run? Here's the Loyola of Chicago run, until they met a certain team from Ann Arbor, MI:
That's a lot of points. More than Kansas accounted for winning the whole thing this year. I think that is accurate. Fans of the sport still remember Sister Jean because what Loyola did was so amazing. I'm guessing 5 years from now, more people will still remember Loyola and have trouble remembering Kansas won the championship this year (unless you are a Kansas fan, which, yuck).
How do I translate this to a conference value?
Take the total score a conference earns, and divide by the total number of teams that conference has in the tourney and you have a conference value. It looks like this:

Now you know the how. Let's do some analysis.
To understand how good or bad a conference is, you have to start with the number of schools it has in the tourney. Here's all of the conferences for the past 5 years. I've highlighted in green which conference won the National Title. Remember, I don't count play in games so Rutgers being the "9th Big Ten" team this year doesn't register for me. There are 64 teams that start playing on Thursday and that is what matters.
 The Big Ten is getting it's fair share of chances. They are only slightly behind the ACC in total teams making the tourney every year. I've been in and around basketball a long time, I'm still amazed at how poorly the Pac 12 has been for a while now. They are getting the same number of bids as mid-majors at this point.
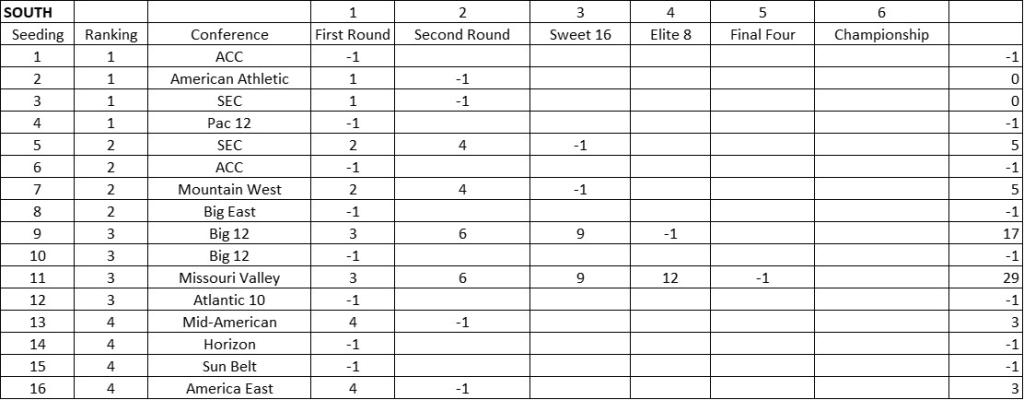
Here's the complete ranking of conference values:
 Here you can see the longevity impact Loyola of Chicago's run had. I touched on this earlier, but I think this formula captures the value of a run like this. Assuming the Missouri Valley Conference doesn't have any more Cinderella's over the next 5 years, their rating will eventually fade back with the rest of the smaller conferences. Same will be true for the Peacocks of the Metro Atlantic Athletic. You can also see the relative consistency of the ACC, the enigmatic nature of the Pac 12, and oh yes, where is the Big Ten? They rank 9th. Or, put another way, only about 5 - 6 spots ahead of the one team and done conferences.
To summarize this a little better: Here's the value rating for all of the conferences who average at least 2 teams/year in the tournament.

I've highlighted the.....uhhhh....lowlights in a maize type color and the best performances in a not Michigan blue color. Yes, let's all point and laugh at the ACC for their pitiful showing in 2021. They couldn't muster even 1 point per team out of 7 teams!!! That's a very impressively poor number. Of course, UNC, Duke & Miami made up for it this past year posting the second best conference value over the past 5 years....sigh. You can see Gonzaga's two national championship runs, and then what happens when Gonzaga get's beat early. Houston has really carried the American Athletic conference the past few years. I may have to give Kelvin Sampson some credit. And where is the Big Ten? For the love of.... SERIOUSLY??? Behind the SEC? The SEC which has had 3 of the more embarrassing performances in the past 5 years? Thank goodness for the Big East at least.
At least there was 2018 for the Big Ten, or should I say, for Michigan. Speaking of which, let's take a look at how Michigan performs vs. the rest of the Big Ten. This is raw points, not the value rating:

Other than 2019, Michigan has been carrying all of the water for the Big Ten. In fact, without Michigan, the Big Ten's collective value rating over these 5 years is: 1.2!!!
THAT WOULD RANK THE BIG TEN ON PAR WITH CONFERENCE USA AND BEHIND THE SUMMIT LEAGUE!!!!
Michigan's individual value rating over this same period is 6.8!!!
The Big Ten really does suck at this basketball tourney thing. I have no idea how they have won as many ACC/Big Ten challenges as they have. I have no idea why they keep getting invited back to the tourney. At this point, I'm guessing all the other conferences like having the Big Ten come over to play because they know they can beat them up.
Anyway, what my eyes & tourney brackets have been telling me for a while now is true.
Michigan is awesome. The Big Ten sucks at March Madness. And I have the data to prove it.
Sounds interesting, I would like to sign up for your newsletter.
TLDR. Diary?
He just keeps going in the wrong place, but it's still welcome
Diaries get too little traffic. I’m fine that it goes here. The only problem is that it’ll soon drop from the first page. Maybe a migration to the diaries after today would be appropriate.
yeah but they last forever. Make this a diary for the longer analysis. This deserves it
TLDR: Michigan is awesome. All the other Big Ten schools suck
This is good shit, OP! All the upvotes to you for collecting the data and analyzing it.
I would only suggest to remove ‘arbitrary’ from your description of the measure. It makes too much sense to be called arbitrary.
I was a cliff notes guy.
respectfully, I have no idea what your data means - I didn't have the energy to make it make sense.
HOWEVER, I do like the topic, and your data looks deep and is presented well. It's a rare TLDR that is still appreciated and instead I will just accept your conclusion. Thanks for doing the hard work for us.
Dayum bruh. That's a lot to comprehend.
A+ for effort
I typically root for B1G teams in bowl games save 2. In the tourney I root for my bracket.
Too drunk to digest. Can someone please provide an executive summary? I have an odd feeling something interesting is contained in the above.
If Michigan wasn't in the B1G, it would would be a shit conference in March Madness.
or
We pretty much single handedly make the B1G look good in March.
In the last five years...
As a scientist, I strongly approve of the data analytics going on here.
On a scientific level I'd say 'beware the law of small numbers'.
I originally set out to do 10 years worth of data, but I am paid to do real market analysis for a living and I have kids on spring break.
Adding 5 more years of data would normalize an outlier like the Missouri Valley Conference and the Metro Atlantic Athletic (as it should).
I don't think adding 5 more years of data would significantly impact the Big Ten or any of the other Power 5 conferences. It would probably help the SEC because you would reach back to some of those Kentucky teams. Keep in mind, those were highly seeded teams so it would probably only lift them to the level of the Big 12.
But sometimes you only have a small set of numbers …. Science is hard and you often can’t get more than an n=3 or n=5
It's funny because 2019 was still a Sweet16 berth/game! We just happened to run into a defensive juggernaut and clearly the best 3-seed (Purdue was great, gave Virginia all they could handle). Sparty lost to them too; they happened to made a further run to get to them, with an easier route, although beating Duke was impressive.
We did score a #25 ranking in the final coaches poll...so there is that!
I would love to see the team-by-team breakdown for the Big Ten, as well as how they perform relative to their seed. I have a suspicion that certain teams (cough msu cough illinois cough) tend to underperform of late compared to other teams. Expectation would be that 1's would make the FF, 2s would make the elite eight, 3s and 4s would make the Sweet Sixteen. But i'm just greedy and too lazy to do the research myself.
Cough Iowa. Cough OSU. Anyone still out there?
Would upvote you if I could.
Soon enough.
Good analysis, thanks
I do agree that I don’t understand how the Bigten performs in out of conference games and early seasons tournaments but stinks in March. If we have been dominating the ACC/Bigten challenge, we should be better in the postseason. I haven’t really looked back at the correlation of drafted/impact NBA players of the Bigten vs other leagues. Does the Bigten not have as much high end talent? Are other conferences doing a better job of keeping players multiple years? These are all things that can play in, along with officiating, coaching and style of play.
I think the Big Ten performs well in out of conference because it's a very well-coached conference that typically doesn't have elite talent so teams start the season well-coached and experienced and hence do well against other teams that are just getting their sea legs.
Also, the Big ten probably has stronger home court advantages compared to most other conferences because of higher attendance.
And then as other, more talented teams catch up throughout the year and play on neutral courts, they make up the difference and then some.
My totally unscientific guess/theory.
I agree with the top end talent gap. Since 2017, B1G teams have had top ten recruiting classes 3 times.
2018 Maryland (7th)
2018 IU (10th)
2021 Michigan (3rd)
Thats it.
I looked at the recruiting class ranks for the last five champions and their rankings leading up to their title. I went four classes prior, which I know doesn’t account for portal and nba departures. It gives somewhat of a snapshot prior to the portal going crazy lately.
2017 N Carolina. 15,10,70,14
2018 Villanova. 48,29,45,28
2019 Virginia. 9,7,98,65 (year after 16 seed loss)
2021 Baylor 81,36,128,31(lots of transfers in)
2022 Kansas 5,15,23,11
Recruiting rankings don’t really tell the story here for the champions. Kansas would be the closest to that being a factor. Michigan prior to their runner up in 2018 was 30,107,31 and 43. I’m feeling like luck obviously plays a lot into it and high end talent sticking around for 3-4 years is the major key.
I believe all of your theories/questions are correct here, it's not just one thing and there's a certain degree of luck.
I would add the Quantity vs Quality factor is also in play here. The data is just a performance evaluation of planned results and does not address the root cause. If my only objective was to do well in the NCAA tournament then I would look at the benchmark models and attributes of the teams doing well year in and year out.
Also, Michigan could have even better comparative data if we were not bit by some untimely injuries.
they have medication for things like this. and therapists.
(j/k - good analysis)
Thank you for the last three sentences. The rest is interesting but, appearances to the contrary, I do have things to do.
While I like your conclusion about Michigan carrying the big ten, I think your approach may be structurally biased to reach that conclusion.
Take a simple example. The big ten has three 12 seeds (including Michigan) that win their first round games and lose in the second round. Each team loses in the second round. They all score 3 points for their first round win and lose 1 point for their second round win. In that scenario, if there are no other big ten teams in the tournament, the big ten total score is. 6 and each team contributes 2 points (or 1/3 of the total). This makes sense.
Now add one more team that loses in the first round. The big ten total score falls to 5. Michigan contributes 2 points so you would say Michigan accounts for 40% of the big ten success.
Two teams lose in the first round and the big ten score goes to 4, Michigan contributes 50%.
Three teams lose in the first round and Michigan contributes 2 of 3 total points or 66%.
With four teams losing in the first round, Michigan will have contributed 100%.
I think the percentage contribution has to be based only on teams that score positive points
What you point out is one of the key issues of the Big Ten. The top seeded teams severely under perform and the lower seeded teams seldom have a miracle run. They average 7 teams in the tournament every year. They are typically seeded in a range between 1 - 11. They all perform about the same regardless of seeding.
Here's a quick sampling of the Big Ten for the past two years:
2022:
Seeding / (Record)
3 / (2-1)
3 / (1-1)
4 / (1-1)
5 / (0-1)
7 / (1-1)
7 / (1-1)
11 / (2-1) Michigan
12 / (0-1)
6 out of 8 teams didn't make it past the first weekend and the two that did promptly lost. Granted, the seeds were all pretty low.
2021:
Seeding / (Record)
1 / (3-1) Michigan
1 / (1-1)
2 / (0-1)
2 / (1-1)
4 / (0-1)
9 / (1-1)
10 / (1-1)
10 / (1-1)
This is one of the more egregious examples. 8 Big Ten teams. 4 Big Ten teams seeded 1 or 2. Collective record of those top 4 Big Ten teams (5-4) Without Michigan they would have been (2-3). That is pitiful. As a reference point, the combined record of the other four 1 & 2 seeds that year was (17-3) including the National Champion. The Big Ten got the preferential seeding and proceeded to shit the bed while the other conferences took advantage of it. Because of that, it would have taken a miracle run from a lower seeded team to earn the Big Ten any points....and that didn't happen.
Michigan's value to the Big Ten has been so high because everyone else has been so pitiful.
Not exactly the point I was making. In my example it is irrelevant what the seed of the teams that lose in the first round is. Using the OPs methodology, whichever team is compared to the collective big ten, you will inflate it’s contribution to the overall big ten record unless there are no teams that lose in the first round. I was focused on the mathematical error in the OPs methodology not the fact that lower seeded big ten teams have done poorly.
To compare Michigan against the rest of the Big Ten, I used Michigan's total points and the rest of the Big Ten's total points. Then I ran the math to see how much Michigan contributed to the overall score of the conference.
I was less concerned on how each team in the conference performed against the other teams and more focused on how the conference (without Michigan) performed overall. Had I been measuring how each team contributed to the conference performance, then the issue you pointed out would have required measuring it differently. For this exercise, that issue does not apply.
Beg to disagree. As I pointed out in my example, Michigan could have performed equally well as several other teams, yet in certain very likely circumstances (any Big Ten team loses in the first round), your methodology will show that Michigan performed better. In my last example, your methodology attributes 100% of the big ten success to Michigan when two other teams did equally well. If you compared each of the other two teams using the same methodology, they would also contribute 100% of the big ten success. That on it’s face makes no sense. As I said, if you only focus on the teams that contributed positive points (e,g. Get rid of the teams that did not contribute to the big tens success), you will be more accurately be calculating Michigan’s contribution to the Big Ten’s tourney success.
I understand the mathematical issue you present. The goal is to measure both success and failure. Even if another Big Ten team accumulated more points than Michigan, if the rest of the Big Ten all lost their first game, that speaks to the whole conference’s performance.
The way I did the comparison speaks to one team vs. the collective and could be done for any one team. If you tried doing this for each team and adding them up you would get a crazy percentage number. That isn’t what is being done. That would require a different formula.
I think you have just agreed to my point. If you could do this analysis for more than one team and come to the conclusion that more than one team “carried the big ten”, it might make sense to re-think the last step in the analysis.
I have run through the example that you suggested a d it makes the point even clearer.
Michigan is seeded 12 and loses in the second round. They score 2 points under your methodology. A second big ten team also seeded 12th, makes it all the way to the sweet 16. They score 8 points under your methodology.
If no other teams from the big ten are in the tournament, the total big ten score is 10 and Michigan is responsible for 20% of it. Directionally that seems to make sense.
If the big ten has 7 other teams lose in the first round, the big ten total score now falls to 3 points. Michigan scored 2 points or 66.7% of the big tens total points. That suggests that Michigan “carried the big ten”. Would a neutral observer agree with that conclusion? It gets even worse if the big ten loses 8 games and your formula assigns a value of 100% to Michigan. As I noted, the methodology used in the last table overestimates Michigan’s impact. It still might be a valid conclusion that Michigan has carried the big ten, I just don’t think you have demonstrated that conclusion.
One way to draw that conclusion would be to take Michigan’s percentage of only the teams that scored positive points. In any season where the big ten had a team lose in the first round, this would lower Michigan’s percentage contribution. Since I suspect that methodology would drive Michigan’s percentage contribution below 50%, it would no longer be a slam dunk that Michigan carried the big ten. You’d probably have to look at the second best team and show that Michigan was substantially better.
Want a job OP? This is good shit, Jedd
You don't work for the Big Ten, right???