The Weekly Six-Notre Dame
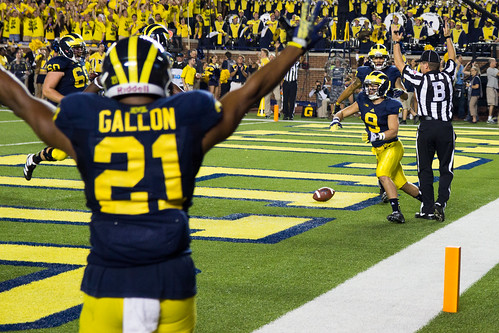
This week’s factor favorite (Upchurch)
1. The Six Factors
| Field Pos | Early Conv | Bonus Yds | Avg 3rd Dist | Adj 3rd Conv | Red Zone | |
| Offense | 15.3 (42) | 55% (40) | 211 (36) | 7.0 (81) | +14% (13) | 7.0 (1) |
| Defense | 23.4 (80) | 41% (30) | 145 (35) | 5.1 (34) | +8% (75) | 3.4 (26) |
*Game score first, season long national rank in ()
Notre Dame had a field position score advantage, mostly thanks to The Worst Pass Ever. Michigan dominated early conversions while more manageable third downs. Brian Kelly teams have traditionally been geared this way, strongly managing third down distance at the expense of facing more of them. Gallon’s big catch a run providing most of the gap in bonus yards as Mattison’s defensive plan limited yards beyond the sticks.
While Michigan continued to be a very good 3rd down team on offense, Notre Dame did well on third down when they had the ball, even beyond the more manageable distances that they faced. The story of the game though was the red zone. Notre Dame made 5 trips into the red zone and came away with 17 points, Michigan made four trips and scored 28. Michigan won by 11.
Two games into the season the national rankings don’t mean much with cupcakes galore and outliers, everywhere. Still, 18 teams have made at least seven trips to the red zone in competitive situations this season, only Michigan and Oklahoma State have scored on every trip. It’s not going to hold up all season, but the evidence is mounting that Gardner is a red zone genius.
[Jump]
Legend
Field Position: A team’s expected points based on where a team started its drives
Early Conversion: The percentage of first downs' that are converted prior to a third down play
Bonus Yards: All yards gained after the first down marker
Average 3rd Down Distance: Average yards to go on third down
Adjusted 3rd Down Conversion: Rate of conversion for a team on third down, adjusted for the standard conversion rate based on yards to go, 0% is average
Red Zone: Points per red zone trip (TD’s counted as 7 regardless of PAT)
All categories except field position are based solely on plays in competitive situations (all first half plays and any second half plays where the drive begins or ends within two scores).
2. Individual Performances
Michigan:
Devin Gardner: +19.4 pts, +51% win pct (+12, +32% pass, +7, +20% rush)
Jeremy Gallon: +16.8, +38%
Fitzgerald Toussaint: +1.7, +17%
Drew Dileo: +3.4, +4%
Two games in and Devin Gardner is putting together more evidence that he could join the elusive +14 value club. Jeremy Gallon was obviously fantastic and although Toussaint’s direct value was slightly positive, the timing of his big fourth quarter run and catch made his win contribution much higher than his point contribution (more below). Although Dileo’s touchdown was huge, the numbers indicate that The Threat’s second down touchdown catch wasn’t as big as several other plays in the game.
Notre Dame:
Tommy Rees: +1.5, –3%
George Atkinson (rushing only): +1.5, +4%
Amir Carlisle (rushing only): +4.2, +6%
Davaris Daniels: +3.8, +7%
TJ Jones: +10.8, +22%
Troy Niklas: +6.4, +10%
Tommy Rees put up the yards, but the two interceptions and 51 attempts indicate how yards aren’t always the best indicator of performance. Rees’s performance didn’t lose the game for the Irish, but he couldn’t win it for them either. On the ground the Irish had more success in limited attempts with both Atkinson and Carlisle generating positive points and win value.
TJ Jones had the big impact in the passing game, with double digit value and a significant win percentage addition.
3. Game Chart

Michigan’s odds of winning the game as time progressed. For a game that felt tight throughout, it’s interesting to see that the game was relatively secure through most of the second half.
The six biggest plays from the game:
6. +7.7%, Gardner to Toussaint for 31 yards on the wheel route
5. +7.8%, Toussaint with the miracle cutback for 22 yards
4. –9.1%, Matt Wile shanks his punt 21 yards
3. +11.3%, Gallon cloaking device: ENGAGED
2. –11.4%, Gardner thinking device: disengaged
1. 11.5%, Countess picks off Rees (+7.7%) and runs it back (+3.8%) to set up Michigan before half
A lot of interesting plays steered this one throughout. Toussaint’s big plays in the fourth quarter were huge in driving the result. Garnder’s brain fart and Wile’s ensuing shank sure felt like killers and they ended up being two of the four biggest plays of the game. In a game with swings like this, it was surprising to see a first half play take home top honors but there is no doubt that Countess’s pick AND run to give Michigan an extra possession before half was a massive swing.
4. Ron Zook Dumb Punt of the Week
Honorable Mention
Wake Forest and South Florida both went the punt route on 4th down trailing by two touchdowns with 5 minutes left. Temple punted from midfield down by 2 with 6 minutes left in the game.
And your winner is…
Southern Miss who found themselves in an early 18 point hole against Nebraska and were facing a fourth and two at the Nebraska 37. After choosing to punt, the Golden Eagles should have just punted on first down from then on.
Bonus: Futile Field Goal of the Week
Idaho kicked a field goal while down 42 points but doesn’t get the vote because they were currently sitting on zero points, so the desire to avoid the shutout is at least partially understood.
UAB gets the first ever Futile Field Goal of the Week, missing a 57 yard field goal while down 32 points to LSU. Not sure what the decision making process was there, but hey I guess if you made you only need three touchdowns with a regular conersion and only one with a two-point conversion to force overtime.
5. Around the NCAA
- Spartan fans have always dreamed of having a team like USC and it looks like may have finally gotten their wish. Both teams are elite good on defense and elite terrible on offense and have no clue which quarterback is the lesser of the evils.
- Maize & Blue Nation’s post-game wrap-up had a point that caught my attention, older RB’s don’t fumble. I quickly ran some numbers and over the last 11 years, true freshmen running backs have fumbled at a rate of 2.34% of carries (lost and recovered). Players with at least 3 years in the program have fumbled at a rate of 2.34% of carries! The experience is still important but there is no evidence to say that the value is in reducing fumbles.
- Tennessee got all of the turnovers from Western Kentucky last week but they went 0-5 in third down conversions, a distance last place at –49% adjusted conversion rate.
- Indiana scored touchdowns on their last 5 possessions, but didn’t have a possession that started beyond their own 25 for the entire game.
6. Akron
| Field Pos | Early Conv | Bonus Yds | Avg 3rd Dist | Adj 3rd Conv | Red Zone | |
| Offense | 6.9 (119) | 59% (13) | 18 (116) | 9.9 (111) | -3% (69) | N/A |
| Defense | 10.4 (9) | 43% (32) | 172 (94) | 5.3 (88) | +19% (106) | 5.0 (48) |
Akron only has one game against a decent UCF team on the books so far (I don’t include last week’s game against James Madison). The offense looks to be geared toward getting to the first down mark. They are good at early conversions but awful at bonus yards and average third down distance which means they are looking to get right at the stick a lot on offense. On defense they were decent about stopping early conversions but bad at everything else. They gave up big plays, short third downs and lots of conversions. It’s just one game of data but it is Akron.
Player rankings:
QB Kyle Pohl (88)
RB Jawon Chisholm (108)
RB Conor Hundley (116)
I have Akron ranked 7th in the MAC in terms of talent and experience which puts them just inside the top 100 nationally at 97.
Prediction
Michigan a lot, Akron not very many and hopefully a big day for the running backs
September 11th, 2013 at 1:19 PM ^
Hey Mathlete! Had a question for you.
I see that Gardner's interception gave us a -11.4% chance at victory. Can you tell us what the number would have been if he had instead accomplished what he was trying to do (throw an incompletion) or done what he should have (take a safety)? Been wondering how the risk/reward numbers stack up once he found himself in the endzone with half the defense in his face.
September 11th, 2013 at 1:38 PM ^
good question, as we all "know" he should have just taken the sack...but what do the numbers really tell us.
September 11th, 2013 at 1:41 PM ^
Great question
Michigan was at 93% going into the play:
Incompletion: still about 93% (it was 3rd and 11, first down was unlikely)
Safety: only drops slightly to 92%, ND field position about the same as a punt, still need two TDs
Reality: dropped to 82%
The safety would have seemed devastating but in reality the interception was the only play that would have really swung the odds.
September 11th, 2013 at 1:44 PM ^
Thanks, that is one of those plays that seems easy enough but I am glad to see the numbers back it up.
September 11th, 2013 at 1:46 PM ^
Interesting! Not what I expected. Thanks for crunching the numbers.
September 11th, 2013 at 3:56 PM ^
September 11th, 2013 at 1:36 PM ^
In regards to MSU being like USC, I really want to see them both reach 6-6 and end up facing each other in a bowl game. Wonder if the coaches will realize they can just punt on first down.
September 11th, 2013 at 2:06 PM ^
Good stuff.
Can you run the same numbers to compare how those same true freshman do later in their careers. I'm curious if there is no correlation at all to experience or if it's possible that true freshman that play do so partially because they already have the ability to take care of the football that perhaps other players only acquire later on.
September 11th, 2013 at 2:08 PM ^
There is some slight random variation but the fumble rates are pretty consistent year after year, regardless of age.
September 11th, 2013 at 3:11 PM ^
Thanks. I suspected that might be the case. It seems guys either know how to secure the ball (Hart) or don't (Hopkins) with I'm sure some that do eventually figure it out through technique changes, strength improvement, etc.
September 11th, 2013 at 2:14 PM ^
UAB still be down by 9?
September 11th, 2013 at 2:15 PM ^
UAB gets the first ever Futile Field Goal of the Week, missing a 57 yard field goal while down 32 points to LSU. Not sure what the decision making process was there, but hey I guess if you made you only need three touchdowns and ONE two-point conversion to force overtime.
If they cut it to 29, wouldn't they need four touchdowns and one two-point conversion?
In your defense, they don't call you the Arithmeticlete.
September 11th, 2013 at 2:22 PM ^
Thanks for the heads up. Poor wording on my part, fixed it.
September 11th, 2013 at 2:25 PM ^
Yep, that did it. Also, great stuff as usual. Should have mentioned that pre-wise ass.
September 11th, 2013 at 2:29 PM ^
Calling Gardner's mistake the "Worst Pass Ever" seems rather unfair. He was obviously not trying to throw a pass but to throw the ball away to avoid a sack.
September 11th, 2013 at 2:39 PM ^
You do know how the internet works, right?
September 11th, 2013 at 9:55 PM ^
The recipients of other "worst pass ever's" in the last 10 years per ESPN note on the ND game...
0-Yard Int Return TD
| Last 10 Seasons | |
|---|---|
| Saturday | Stephen Tuitt, Notre Dame |
| Oct. 10, 2009 | Akeem Ayers, UCLA |
| Sept. 23, 2006 | Marcus Buggs, Vanderbilt |
| Nov. 19, 2005 | Ray Henderson, Boston College |
The passers were:
2009 - Nate Costa, #13 Oregon
2006 - Antonio Hefner, FCS Tennessee State (was at South Carolina a year earlier)
2005 - BC vs. Maryland. Ray Henderson's INT TD was 35 yards per the recap. Need to get the Schwab back, ESPN.
September 11th, 2013 at 9:42 PM ^
The mistake was the ball ever leaving his hand at all.
September 11th, 2013 at 2:40 PM ^
writing is great, too. Very entertaining!
September 11th, 2013 at 3:46 PM ^
September 11th, 2013 at 3:16 PM ^
They ended up averaging 2.5 yards per play, both passing (!!) and running, were 1-13 overall on third down (with the conversion by penalty, of course), and were facing a team with an offense nearly as bad as theirs. Their previous possession ended on a failed 4th-and-4 from the Spartans' 32, the only USF fourth-down attempt of the game. Their only hope to cut into that deficit was to give the ball back to MSU and force them to run some plays ... sadly, it didn't work out, but in this particular case, I think it was the right call.
On the other hand, on the second play of the fourth quarter, South Florida punted from their own 8 ... for 15 yards. (Sparty did get a touchdown on that drive, but not before ending up with a 3rd and 21.) So ... maybe the problem was not punting on third down.
We were watching that game in preparation for the big one. It was one of the worst offensive showings I've ever seen, and my family had season tickets to IU games in the late '70s.
September 11th, 2013 at 3:35 PM ^
I watched the game, I know what was happening but with MSU Defense and the USF offense, but come on. Best case scenario after that punt is to get the ball back where you had it, down 15 with a minute and a half to go. In a one possession game you can justify a punt but not when you need two possessions punting is game over.
September 11th, 2013 at 5:52 PM ^
but that's the problem that USF has. They're so bad that there are some situations where no decision is any good.
I mean, 6 for 26. They were 19 of 40 against McNeese State. If there were ever a modern team for which the quick kick was designed, it's USF.
September 11th, 2013 at 3:27 PM ^
Mathlete, great work as always. But I have a question: You say that the "Field Position Score" was affected largely by The Worst Pass Ever. Should I take that to mean you're counting all pick-6s as, basically, starting field position of 0 yards? Or is it more like "I'm spotting them 7 free points for a defensive score".
Can you explain a bit more why you made that choice? Because to me a pick 6, since the offense never touches the ball, doesn't really tell me much about an offense's (or defense's) effectiveness relative to starting field position. I thought that was the goal of the stat.
September 11th, 2013 at 3:28 PM ^
Have you ever looked at using other statistical categories for qualification?
I mean, would using median instead of mean (average) influence ranking at all? That would throw out the outlier plays, possibly at the expense of penalizing quick-strike teams.
In a similar vein, would standard deviation serve a similar function to categorize offensive/defensive efficiency? I realize that would reward "grind-it-out" offenses and "bend-but-don't-break" defenses, but categorizing Getting Torched/Homerun play frequency might be interesting.
September 11th, 2013 at 4:55 PM ^
Mathlete - Just wondered why your Game Chart shows Michigan's initial win percentage at just uner 50%, when most trustworthy agents (i.e. the betting markets and your game prediction to name a couple) had Michigan as a small to medium favorite. I know Corso donned the leprechaun hat on GameDay, but I'm assuming that's not feeding into your metrics at all.
Your game prediction did mention that your metrics had Notre Dame ranked at 15 and Michigan at 17, so I'm assuming that's the reason, but does your game chart not factor in home-field advantage in it's initial win percentage estimate?
Inquiring (nerdy) minds want to know.
Comments