National Statistics And How Close Are We To That Winning Season?
Will Michigan have a winning record this year, how close are we, and where do we need to improve to get there? I decided to look at National Rankings for Offense and Defense and the corresponding Win/Loss record.
I reviewed all the offensive and defense stats and Scoring Offense and Defense has the best correlation to wins and losses. (This is probably obvious but some folks seem to get all excited about Total Offense and Defense based on yardage. Last time I checked, yardage has never determined the winner of a football game.) There are now 120 FBS teams so I picked a rank of #60 for the analysis.
For the past ten years:
- 98% of teams that are ranked #60 or higher for both Scoring Offense and Scoring Defense had winning records.
- 62% of teams that are ranked #60 or higher for either Scoring Offense or Scoring Defense (but not both) had winning records.
- 6% of teams that are ranked #60 or higher for neither Scoring Offense nor Scoring Defense had winning records.
Here is a table showing National Rankings for the last 10 years:
- The number of teams that finished with BOTH Scoring Offense and Defense Ranked in the Top 60. Of those, the number with winning records, and the % with winning records.
- The number of teams that finished with EITHER Scoring Offense or Defense Ranked in the Top 60. Of those, the number with winning records, and the % with winning records.
- The number of teams that finished with NEITHER Scoring Offense nor Defense Ranked in the Top 60. Of those, the number with winning records, and the % with winning records.
|
Year |
|
Both Top 60 |
WR |
% |
|
Just One |
WR |
% |
|
Neither |
WR |
% |
|
2009 |
|
34 |
34 |
100% |
|
51 |
30 |
59% |
|
35 |
2 |
6% |
|
2008 |
|
37 |
37 |
100% |
|
42 |
30 |
71% |
|
40 |
2 |
5% |
|
2007 |
|
34 |
33 |
97% |
|
52 |
33 |
63% |
|
33 |
1 |
3% |
|
2006 |
|
31 |
30 |
97% |
|
52 |
35 |
67% |
|
36 |
4 |
11% |
|
2005 |
|
34 |
33 |
97% |
|
50 |
29 |
58% |
|
33 |
1 |
3% |
|
2004 |
|
31 |
29 |
94% |
|
58 |
28 |
48% |
|
28 |
4 |
14% |
|
2003 |
|
42 |
42 |
100% |
|
34 |
22 |
65% |
|
41 |
2 |
5% |
|
2002 |
|
40 |
39 |
98% |
|
35 |
25 |
71% |
|
42 |
3 |
7% |
|
2001 |
|
38 |
37 |
97% |
|
45 |
29 |
64% |
|
32 |
1 |
3% |
|
2000 |
|
37 |
37 |
100% |
|
43 |
24 |
56% |
|
34 |
3 |
9% |
|
|
|
|
|
|
|
|
|
|
|
|
|
|
|
Total |
|
358 |
351 |
98% |
|
462 |
285 |
62% |
|
354 |
23 |
6% |
The next table shows Offensive and Defensive PPG for teams ranked #1, #60, and #120 (or last team when there were less than 120):
|
Offense PPG |
|
Defense PPG |
|
|||
|
Year |
#1 |
#60 |
#120 |
#1 |
#60 |
#120 |
|
2009 |
42.21 |
27.42 |
11.46 |
10.43 |
25.46 |
43.08 |
|
2008 |
51.14 |
24.38 |
12.67 |
9.00 |
24.67 |
47.58 |
|
2007 |
43.38 |
27.85 |
15.08 |
12.80 |
27.00 |
45.10 |
|
2006 |
46.86 |
23.42 |
9.58 |
11.00 |
22.80 |
41.70 |
|
2005 |
50.15 |
26.64 |
9.73 |
10.70 |
24.82 |
45.30 |
|
2004 |
49.75 |
24.82 |
14.00 |
11.30 |
25.50 |
42.60 |
|
2003 |
43.00 |
26.83 |
11.17 |
11.00 |
25.50 |
39.30 |
|
2002 |
45.62 |
27.25 |
13.92 |
11.80 |
26.30 |
47.20 |
|
2001 |
46.77 |
26.58 |
10.82 |
9.40 |
25.70 |
45.00 |
|
2000 |
44.91 |
25.55 |
8.73 |
9.60 |
25.50 |
41.10 |
|
|
|
|
|
|
|
|
|
Average |
46.38 |
26.07 |
11.72 |
10.70 |
25.33 |
43.80 |
Now, let’s look at a table showing Rich Rodriguez’s National Ranking at WVU and Michigan.
|
Year |
Offense National Rank |
|
Defense National Rank |
|
|
|
||||
|
WVU |
Rushing |
Passing |
Total |
Scoring |
Rushing |
Passing |
Total |
Scoring |
TOM |
Record |
|
2001 |
36 |
96 |
80 |
89 |
104 |
1 |
40 |
51 |
98 |
3-8 |
|
2002 |
2 |
108 |
18 |
33 |
30 |
55 |
33 |
40 |
4 |
9-4 |
|
2003 |
13 |
105 |
72 |
40 |
34 |
104 |
74 |
44 |
4 |
8-5 |
|
2004 |
7 |
104 |
26 |
29 |
50 |
32 |
37 |
28 |
46 |
8-4 |
|
2005 |
4 |
115 |
50 |
31 |
19 |
34 |
15 |
13 |
7 |
11-1 |
|
2006 |
2 |
100 |
5 |
3 |
13 |
109 |
62 |
49 |
25 |
11-2 |
|
2007 |
3 |
114 |
15 |
9 |
18 |
14 |
7 |
8 |
9 |
11-2 |
|
|
|
|
|
|
|
|
|
|
|
|
|
U/M |
Rushing |
Passing |
Total |
Scoring |
Rushing |
Passing |
Total |
Scoring |
TOM |
Record |
|
2008 |
59 |
108 |
109 |
101 |
50 |
87 |
67 |
84 |
104 |
3-9 |
|
2009 |
25 |
81 |
59 |
41 |
91 |
67 |
82 |
77 |
115 |
5-7 |
Conclusions:
- From 2008 to 2009, U/M improved in all phases of the game except Rushing Defense which went from #50 in 2008 to a very ugly #91 in 2009 and, of course, TOM which went from gawd awful to worse!
- U/M’s Offense is already good enough to result in a winning record. There is no reason to believe it will not continue to improve this year.
- So, yeah, Defense is the key. If we can improve from #77 to at least #60, a winning record should be a lock. How much improvement is this? Our defense allowed 27.5 PPG and the #60 ranked team allowed 25.5 PPG. So that is about a 10% improvement. The #40 ranked team allowed 22.4 PPG which would be about a 20% improvement.
- For Rushing Defense, we allowed 172 YPG and the #60 team allowed 144 YPG. That is about a 16% improvement. This should be doable. The strongest part of our defense will be against the run. The most experience is at OL and LB (4 seniors, a junior, and Death ROH).
- For Passing Defense, we allowed 221 YPG and the #60 team allowed 218 YPG. That is less than a 2% improvement. So, if the DBs can just stay the course we should be OK.
- Look at those Offensive Passing Ranks for WVU! Yikes, I knew RR’s scheme was a run first spread offense but I never thought the passing would be that low. Even though I have been an advocate for Tate to start because of his experience, RR history says the stronger runner will start. Uh, that would be Denard.
- As to the question of which is more important – Offense or Defense – the answer is: They Are Equal. Over the 10 years, 88 teams that finished in the top 60 in offense but not in defense had losing records and 89 teams that finished in the top 60 in defense but not offense had losing records.
You can check how we are doing during the year at:
August 28th, 2010 at 1:30 PM ^
You have made me fell good inside about this season by doing what MGoBloggers do, i.e. throwing lots of numbers and charts at me that overwhelmingly say I should be confident.
Here's to hoping improvement makes the numbers pan out. Single digit rankings would be nice.
August 28th, 2010 at 1:40 PM ^
with a high ranking offense and a low ranking defense vs. those with a high ranking defense and a low ranking offense.....the former could very easily resemble what the team looks like this year.
August 28th, 2010 at 2:23 PM ^
...might dispute your contention that there's no correlation between offensive and defensive YPG and winning percentage.
Great work, nonetheless.
August 28th, 2010 at 2:34 PM ^
I don't think I posted that there was NO correlation between YPG and win%. I just said the correlation between PPG and win% was better than YPG and win%. Sorry for any confusion.
August 28th, 2010 at 2:36 PM ^
2004 was a weird year
August 28th, 2010 at 2:41 PM ^
but I'd love to see how these charts look if you use a 0.667 win percentage (e.g.8-4) as your metric rather than 0.500 (winning season) as you have here. What fraction of teams with scoring offense and (or) scoring defense ranked #40 or better go 8-4 or better? Looks like our offense is only one place away from that already, while the defense is a long way off. So I guess the real question is, what fraction of teams who ranked #40 or better in only one of the two (offense or defense) went 8-4 or better?
A second interesting follow-up question: you note that for a 0.500 record, offense and defense are equally important. I wonder if that equality holds as you raise the bar for win total. Are offense and defense equally important for reaching, say, 10 wins? Previous work suggests that at some point, defense becomes more important. (Though that may be a slightly apples-to-oranges comparison, as MCalibur used yards, not scoring rank.)
August 28th, 2010 at 4:25 PM ^
I looked at 2009.
There were 17 teams that had BOTH offense and defense in the Top 40 -- 15 had an 8-4 reocrd or better (88%).
There were 45 Teams that were in the Top 40 for either Offense or Defense -- 19 had a record of 8-4 or better (42%).
34 Teams had a record of 8-4 or better.
Of these 15 were in the Top 40 for both Offense and Defense
11 were in the Top 40 for one and in the Top 60 for the other.
8 were in the Top 40 for one and were NOT in the Top 60 for other.
No teams were 8-4 or better without having at least either Offense or Defense in the Top 40.
August 28th, 2010 at 5:34 PM ^
Thanks for the added breakdown.
August 28th, 2010 at 3:15 PM ^
Your response to mgoshoe makes it likely that you are talking about PPG, that is, for example, the total points scored as the result of passing plays would be "passing offense" in your charts above. When I googled scoring offense, though, the first website I found (sportsratings.typepad.com) defined scoring offense as "expected score attained against the average I-A (FBS) defense," and didn't distinguish between passing and running offense. (FTR, 2009 Michigan was ranked 54th in offense and 84th in defense.) I'm sure there are other ways of measuring scoring offense and defense.
My interpretation of your metrics is that you are only looking at those particular plays that resulted in a touchdown. That is, a team could matriculate down the field for 79 yards on all pass plays, then run it in from the 1-yard line, and you would count it as a rushing score. Is that correct?
Thanks,
August 29th, 2010 at 7:02 AM ^
I believe you are correct. The data is from the NCAA website. I tried to find their definition but have not been successful.
http://web1.ncaa.org/mfb/natlRank.jsp?year=2009&div=IA&site=org
EDIT: I must have had a brain freeze. Looking at the data, it is obvious the offense and defense rankings for "rushing" and "passing" and "total"are based on YPG whereas the ranking for "scoring" is based on PPG.
So, even though I based the analysis on PPG, to get a look at where improvements might be needed, I had no choice but to go back to YPG to differentiate between rushing vs. passing.
I don't think it would be meaningful to break down PPG by rushing vs. passing. There would also be a problem with extra points and field goals. (Would these be categorized as passing because they go through the air? -- just kidding.)
August 28th, 2010 at 3:13 PM ^
The thing that stands out to me is the 2006-2007 improvement for WVU's defense. They went from 62 to 7 overall!?!? Furthermore, the pass defense went from 109 to 14. Wouldn't it be tits if we saw that kind of improvement?
August 28th, 2010 at 3:27 PM ^
It would be tits indeed.
August 28th, 2010 at 3:29 PM ^
If we did, we would certainly be going to the Rose Bowl.
August 28th, 2010 at 3:44 PM ^
I thought the title was a joke, "how close are we to that winning season". Did I stumble across an Eastern Michigan blog?
August 28th, 2010 at 5:07 PM ^
Maybe you haven't been around for the past two years, but our team has been abysmal.
August 28th, 2010 at 4:24 PM ^
Good work sir. Turnovers are the biggest thing that holds a team back. Had we been more cautious with the football last year we would have went bowling. Iowa, MSU, and Illinois come to mind, because all 3 of those should have been victories. This year is going to be great. Revenge is best served cold.
August 28th, 2010 at 5:06 PM ^
Onside kickoff against Purdue? That is a turnover IMO, and cost us another victory.
August 28th, 2010 at 6:17 PM ^
August 28th, 2010 at 9:07 PM ^
And, the fake punt in the state game. That is not counted as a turnover (I guess because the ball was going to the other team anyway?) but certainly cost us that game too.
August 28th, 2010 at 5:05 PM ^
Great simple analysis. Well done.
One question: by "winning season" I'd guess you mean 6-6 (bowl elgibile) or better? IMO a winning season is >.500, so I just want to clarify.
August 28th, 2010 at 9:09 PM ^
I included 6-6 as a "winning" season because that will almost always get BCS teams to a bowl game. Thus, you either win the bowl game and end up 7-6 or lose (like msu) and end up 6-7.
There were very few 6-6 teams.
August 28th, 2010 at 5:25 PM ^
Good work!
Defeat never comes to any man until he admits it.-----Josephus Daniels
Here's to anything helping keep my dreams alive.
August 28th, 2010 at 7:56 PM ^
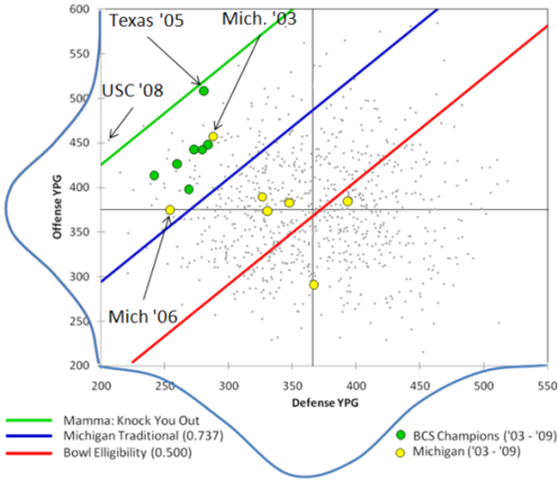
Take a look at the offensive and defensive rankings for the National Champions since 2000, all of them had top 10 defenses. Ohio State was the only exception; they were ranked in the low twenties. A good offense can stop themselves, a good defense rarely hurts themselves. If I had to pick between having an elite offense and having an elite defense, I'd pick defense every time.
Also, points scored obviously determines the outcome of games. However, yardage is a more reliable gauge of the quality of a team's performance. Two top of mind examples are Michigan v. Wisconsin 2008 and Michigan v. Michigan State 2009. The final score of either one of those games did not indicate just how badly Michigan was dominated in both cases. In the case of that Wisconsin game, the points say the Michigan was the better team, that's simply not the case.
August 28th, 2010 at 9:18 PM ^
Not sure if using 1 team is a very good basis for analysis (well, I am sure it is NOT a good basis). Here are all the teams with WLM (Win/Loss Margin) of 8 or greater in 2009 and their rankings. To me this still indicates that offense and defense are equal.
| OFF | DEF | WLM | ||
| Team | CONF | 2009 | ||
| Boise St | WAC | 1 | 14 | 14 |
| Alabama | SEC | 22 | 2 | 14 |
| Texas | Big12 | 3 | 12 | 12 |
| Florida | SEC | 10 | 4 | 12 |
| Cincinnatti | BigEast | 4 | 44 | 11 |
| TCU | MW | 5 | 6 | 11 |
| Central Mich | MAC | 13 | 17 | 10 |
| BYU | MW | 11 | 29 | 9 |
| Ohio State | Big10 | 49 | 5 | 9 |
| Penn State | Big10 | 52 | 3 | 9 |
| Iowa | Big10 | 86 | 8 | 9 |
| Georgia Tech | ACC | 15 | 56 | 8 |
August 28th, 2010 at 9:39 PM ^
What are you talking about? I said National Champions since 2000. Going by generally accepted pre-school mathmematical practices that's 10 teams. All 10 BCS National Champions from the last DECADE had great defenses; 9 of them were in the top-10 of their season. If that isn't a clear validation of the cliche "defense wins championships" I can't help you. I'll say it again, if given a choice, I'll take an elite defense.
| Year | Team | Def Rank |
|
2000
|
Oklahoma | 8 |
| 2001 | Miami (Florida) | 6 |
| 2002 | Ohio State | 23 |
| 2003 | LSU | 1 |
| 2004 | USC | 6 |
| 2005 | Texas | 10 |
| 2006 | Florida | 6 |
| 2007 | LSU | 3 |
| 2008 | Florida | 9 |
| 2009 | Alabama | 2 |
August 28th, 2010 at 9:59 PM ^
Hmmmm, you are right. I still don't think 10 data points over 10 years is significant.
But, more importantly, you seem to have left out the Offense ranking for those same teams and, you apparently used YPG for Defense ranking which (as I said) does not correlate as much as PPG to win/loss records.
Here is the Offense and Defense ranks based on PPG.
| Year | OFF | DEF | |
| 2009 | Alabama | 22 | 2 |
| 2008 | Florida | 3 | 4 |
| 2007 | LSU | 11 | 17 |
| 2006 | Florida | 23 | 6 |
| 2005 | Texas | 1 | 8 |
| 2004 | USC | 6 | 3 |
| 2003 | LSU | 19 | 1 |
| 2002 | osu | 41 | 2 |
| 2001 | Miami | 3 | 1 |
| 2000 | Oklahoma | 7 | 7 |
So, yes, you are correct that more MNC had Defenses in the Top 10 (9) But, 5 also had Top 10 Offenses.
August 28th, 2010 at 10:31 PM ^
I guess my skull hasn't been bashed into enough walls this week. Oy...
Dude, you've only made my point stronger. Over half (6 of 10) of those defenses were in the top 5 (!!!) in their championship year. The "worst" defense improved from ranked 23 to 17.
Also, is 9 (top 10 defenses) not more than 5 (top 10 offenses)? I'm not sure but, isn't it almost double?
Those aren't just 10 data points, brother. That's 100% of a decade's worth of national champions. It's also 100% of the available data. There's only 1 best team in the country every year. Winning the crystal football is the friggin point!
Sigh, whatever. If it makes you feel better, I relent. (That means you win.) That'll save us both 12 hours and, me, a bottle of aspirin.
August 29th, 2010 at 12:21 AM ^
August 29th, 2010 at 3:51 PM ^
I wish I would have thought about doing something like this for my methodology class when I was in school. It would have made the project a lot more fun to work on. Here is to hoping the whats on paper is what happens on the field.
Comments