On Hockey's Rollercoaster Problem

Bill Parcells is famous for saying "you are what your record says you are," which is a good thing for a coach to say. Coaches are in the motivation and dedication business. They are not in the "being accurate in press conferences" business, though, and a lot of people interested in how to project past performance into the future think Bill Parcells is wrong.
I do, too, which I why I've been saying Michigan hockey was snakebit instead of trying to draw up plausible mechanisms why they'd spend slightly more than half their time napalming opponents and slightly less than half their time losing to them in improbable fashion. This post is an attempt to justify that assertion.
[After THE JUMP: graphs! charts!]
A long time ago in a sport far, far away, Bill James found out that run distribution didn't really matter in baseball. You know, except in your record. A team that wins a game 21-0 and loses a game 0-1 is probably better than a team that wins 2-1 both nights, and if those numbers represent a true performance level over time the first team will outperform the second. James came up with a formula that projected a team's future performance based on run differential: the Pythagorean Theorem of Baseball.
This settled into the conventional wisdom amongst baseball statheads, who have the biggest brains and cleanest data sets of any statheads anywhere. And while great towers of projection models have been built that outperform that simple Pythagorean formula, the formula remains pretty good. As first approximations go, it's a good one.
Folks have busied themselves applying the Pythagorean model to other sports, including hockey. The results are invariably "yes, it applies." This makes sense particularly in the context of hockey, where a high rate of puck turnover means that even when a team is nursing a one-goal lead late will almost always prioritize getting the puck in the opposition zone and trying to score over merely possessing. The study linked above does a bunch of math to suggest that goals scored and allowed are (almost entirely) independent events. So the Bill James insight applies to hockey in general and Michigan hockey in particular.
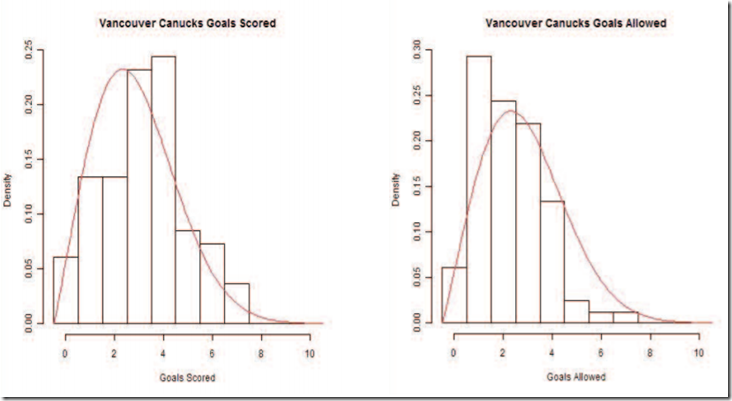
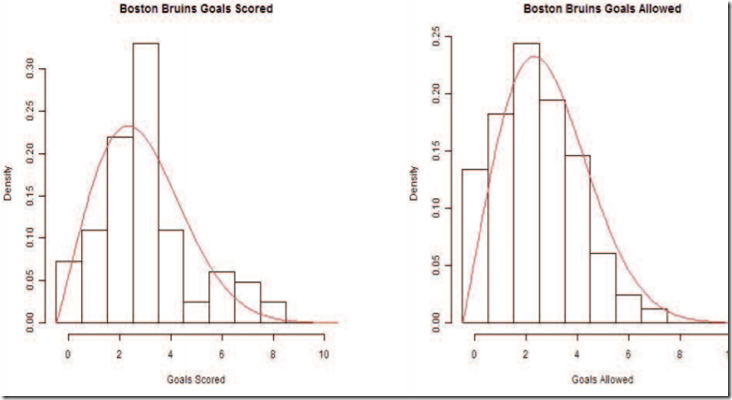
So do other statistical frameworks. Over the course of an NHL season teams end up with goal distributions like this:
This is what you'd expect for a bunch of mostly random trials repeated over and over again. These are more or less normal distributions: big bump in the middle tapering off on both sides. Good NHL teams move the scoring bump to the right and the scored on bump to the left, but there's a bump.
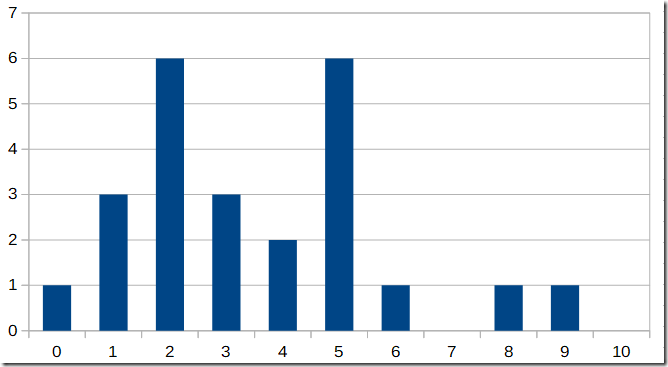
Now here's Michigan's goal distribution, which is not normally distributed at all:
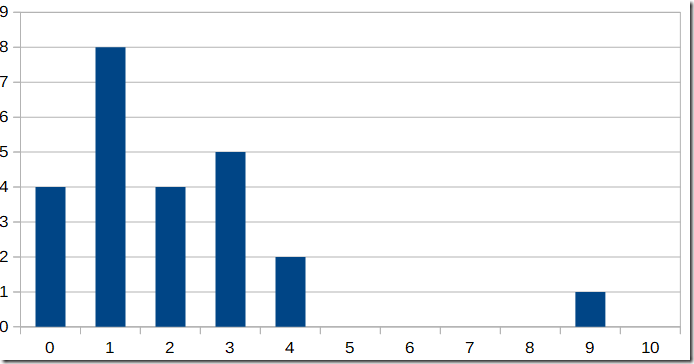
Michigan's goals allowed is normally distributed, more or less, with a mode at 1:
Combining these two graphs and getting a 15-10-1 overall record is quite a trick. There's the team that wins 21-0 and loses 0-1.
Does this mean anything about Michigan's true level of performance? I think the answer to that is almost certainly no. The NHL teams above have a lot more games to settle into their distribution and hockey is fundamentally a game of a lot of chances where very few go in. Michigan had a short season even by college hockey standards, and I can't possibly imagine a mechanism via which Michigan would be prone to have this giant, unnatural split. "They're young and inconsistent" is one story, but if you watch those games you don't see a team that's performing in wildly different fashion night to night. When Michigan played MSU this year:
- 9-0 win: 44-21 shot advantage
- 2-3 loss: 40-27 shot advantage
Similar patterns occurred in Michigan's SCORE EVERYTHING ON AGGREGATE weekends in the second half of the season.
Meanwhile, modern attempts to put a little more detail into hockey stats, and use them for projection purposes, have moved the primary thing tracked from goals (low frequency, high randomness) to shots (high frequency, low randomness). Shooting ratios are more predictive than goals. Michigan finished 5th in even strength Corsi this year with 57.3% of shots*. One of the teams they finished behind, Penn State, has seemingly built its program around the idea of gaming Corsi.
So unless you think there was a real reason Michigan's goals—but not their shots—fluctuated wildly, Michigan scuffling to a 60% winning clip and what seems like the tourney's ~8 overall seed isn't a reason to be disappointed in the hotshot recruits not living up to the hype. It's just a thing that can happen in a short season in a pretty random sport.
Michigan was +40 in goal differential, and if you take the generally-agreed-upon exponent (1.927) and plug that into the pythag equation you get a 75% winning clip, and that's after a season in which Michigan played a four-game round-robin against seven teams except for missing out on a couple games each against MSU (-37 goal differential) and PSU (-16). If Michigan finished 19-6-1, which is what pythag projects, the world looks very different when… uh… Michigan's season gets canceled in the tournament because of COVID.
Maybe look at it as a blessing. Being a one seed and getting the boot would have been so much worse.
The upshot here: Michigan did perform as one of the elite teams in the country despite their youth—the top six scorers were five freshmen and a sophomore, with three of the freshmen 2021 draft eligible—and unless they get unsustainably raided by the NHL next year should be a rampant one. Big "unless," I know.
*[They were 33rd in PP Corsi with a 47% shooting ratio because they did not get PPs and ended up on the PK more; they are the only team in the top 20 of Corsi with a PP shooting ratio under 50%. Fodder for your officiating conspiracies.]
You forgot to mention the Plinkoness of hockey. More than any other sport the bounces and flukiness have a huge impact on the game. Hoping for a title in the next three years. Why can't we have nice things?
I guess you did mention it:
"It's just a thing that can happen in a short season in a pretty random sport."
Ken Dryden's piece on goalies made the rounds here recently. TL;DR- they've really got to make the pads smaller to cut down on goal randomness.
Wasn't Dreyden's piece more about "make the nets bigger"?
They've already shrunk the equipment and it hasn't mattered.
If you separate the goals for histogram into Night 1/Night 2, it looks like two normal distributions, with the first night centered on 5 and the second night centered on 2. I'm not strong in stats, but I suspect that trying to build a distribution out of 13 data points is starting to get dicey. It just seems really, really strange to score almost two goals more on average during the first game of a series than the second (or first game of the B1G tourney vs. second). I don't have a hypothesis for why that would be.
I was thinking this as I was reading, but I think it makes perfect sense.
The first night teams are typically seeing each other for the first time and are not really sure what to expect. Even in the second series, it is a different environment and different players may have emerged. I think that favors a supremely talented team like Michigan.
The second night, the team that lost has a better understanding of what to expect and typically plays a little harder, more focused, more crisp. The team that won the first night by a large margin feels they have less to change to win the second game. This will typically lead to a closer game.
Only the truly elite teams have the ability to play at the highest level night after night. I would not expect that with a young, albeit very talented, team.
Of all the sports stats out there, I hate Corsi the most precisely because it can be gamed. Worse, taking steps to maximize Corsi can result in you digging the puck out of your own net.
I guess it can be gamed but why would you? The point of the game is still to score goals, not just take shots. I think Corsi works because except for outlier teams like Penn State, Corsi is a stat that correlates with possession, goals and winning, but tamps down the randomness by increasing the amount of trials. It's not perfect because not every shot is equivalent, but it's pretty good.
I think Corsi is more useful than rushing stats in football - everybody has conditioned to know that "establishing the run" is good for winning games, when of course that has the cause an effect backwards, to the extent there is any correlation in the first place. A team that runs exclusively is "gaming" the rushing stats but is probably not going to do very well since they're so one-dimensional.
I hate Corsi because of his incessant SEC BABY nonsense, but. . . oh. Uh. Never mind.
I mean, Corsi is an analytic tool that is predictive of success based on gauging offense generated by puck possession.
While possible to “game” Corsi, it doesn’t benefit your team to do so. In general, your goal as a team is to generate more shots and possess the puck while limiting opponent shots and possession. Corsi simply attempts to measure that.
So there’s no real reason for you, as a coach, to “take steps to maximize Corsi.” It’s just a measurement tool.
Note that hockey goal scoring should follow a Poisson distribution--not a normal distribution.
That may be your point anyway, and you are just using "normal" to loosely describe any predictable distribution that is not technically a Normal Distribution, but if there's anybody interested in doing more digging, hockey goals follow a Poisson distribution.
Don't know man, that sounds fishy.
Was about to say this. But p is based on the normal.
Nitpick: the goal graphs look like Poisson distributions, rather than Normal distributions. A Normal distribution has probability assigned to the whole number line (including negative numbers, which aren't possible). A Poisson distribution is used to model the number of random events that occur in a fixed time period, and like a hockey game, can't have a negative number of events.
We need to send stephenjrking deep undercover at Duluth to figure out how they have cultivated such hockey luck. After we noted in the tournament preview how inexplicably good Duluth had been in OT, they got a W by covid cancellation (sigh), were fortunate to escape yet another OT game, and now UMass has some covid cases brewing and Duluth may be looking at a 2nd cancellation to get them to the title game.
Frustrating we didn't even get a chance. I agree this team was better than their record and with a few guys almost certainly going to the NHL, it sucks this team never really got a full season
I remember reading, I think it was, a 538 blog post about sports randomness sometime last year. They noted that in basketball playoffs, we play a best of 7 series to determine the winner. And that was pretty good at the best teams advancing. The team with the better regular-season record advanced something like 75% of the time in basketball's best of 7 format.
This blog also noted that if we wanted to get the same certainty out of hockey, we'd have to play series that were something like best of 65 series.
Hockey is just like, really random.
Michigan's goal distribution definitely looks like it isn't Poisson distributed. (And yes, Alton and grsbmd are correct these are certainly not normal distributions in the statistical sense. The article Alton linked was a fascinating skim.)
I'm wondering if the non-Poisson shape of Michigan's goal scoring statistics is because there is something about Michigan's goal scoring that violates the assumption of Poisson statistics or if there simply isn't enough data. 26 games vs. 82 games is a significant dropoff in the number of trials that are given. It would be interesting to look at NHL goal scoring data and pull out 26 game samples to see if that pattern exists in NHL data.
That's what we need around here...fodder for officiating conspiracies.
Btw, how much money did the E8 crew have on UCLA.
I do think we're seeing a bit of a sample size issue; 26 games is pretty small and especially with rosters also been shook up by the various international tournaments you're likely to see even more variance.
That said, I do think Michigan being a bit snakebitten is real this year and you hope with an older team and a full offseason to prepare we'll see those variations even out a bit.
Brian, wouldn’t be a cumulative normal distribution instead of a normal distribution?
Just saying...
Are all hockey shots equal? Do no other variables impact the probability of scoring? If we look separately at break-aways, “assisted” shots, point blank shots, deflections, shots from the blue line, shots by defensemen, power play shots, short-handed shots, shots with the lead, shots in the last minute of a period, shots by star players etc etc do they all exhibit the same distribution? Or conversely, are there variables that make some shots better than others (beyond the obvious empty net)?
I’m a very casual hockey fan, but looking at basketball as an admittedly flawed example makes me wonder. In hoops half court heaves, desperation attempts late in the shot clock etc are not equal to other 3-PT shots. Are there any indicators of a quality shot in hockey?
I know watching game it can sometimes seem like a team is getting a lot of nominal shot attempts but not really close to scoring. Is it just random that one team seems to throw the puck into the opposing goalies chest 30x while the other only gets 20 shots but all of the require the goalie to make a brilliant save?
A pretty basic one is the “House.” A rather large majority of goals in hockey are scored in what’s called “the house.” A pentagon (or house shaped) area that extends from the posts, to the face off dots, to the top of the circles and meeting in the middle.
A team that generates a high number of “house” shots will generally create more scoring opportunities and more goals.
There’s a lot of analytical data that can be used to measure specific situations, but it’s difficult to measure and put into a predictive formula because hockey IS very random. But in most cases, Corsi and House (for and against) are going to be pretty accurate indicators of team success.
That seems basic to the extreme is simply a matter of angles.
If hockey is as random as is suggested, it would seem that there is way too much passing in the sport.
while there’s truth to the above, M wasn’t great when other teams played with more physicality, which was fairly often. Not sure how to chart that.
I fully expect the team to get unsustainably raided by the NHL. This is Michigan Hockey, after all.


Comments