39 Bowl Games: Attendance and Other Numbers

Overview
There were 39 bowl games played, not including the championship game. There would have been 40 but the First Responders Bowl was canceled. That's a lot of bowl games.
When the bowl season began, I started tracking the attendance for each bowl. I wanted to see how many bowls were played before mostly empty seats. As the bowl season progressed, I captured more data in an attempt to gauge how 'good' or 'bad' the game was. I didn't watch every game, and I didn't want to dig into every boxscore to come up with a rating, so I went with a simple approach:
- A large stadium mostly empty was 'bad'
- A smaller stadium mostly full was 'good'
- A game with a lot of points scored was 'exciting,' and therefore 'good'
- A game where a lot of points were scored *and* the margin of victory was small was 'more exciting' and therefore 'more good'
- Finally, a high-scoring and close game in a mostly full stadium was a 'good' bowl; a blowout in a mostly empty stadium was a 'bad' bowl.
That methodology has two glaring faults:
- The raw score of a game is not always a good measure of the quality of the game. The MSU vs. Oregon game is the best example: close game, but horrible in every way.
- It assumes the announced attendance figure represents actual attendance, and I doubt very much that's the case for most of the bowl games.
But I went forward anyway because it was fun to track the bowls and play with spreadsheets.
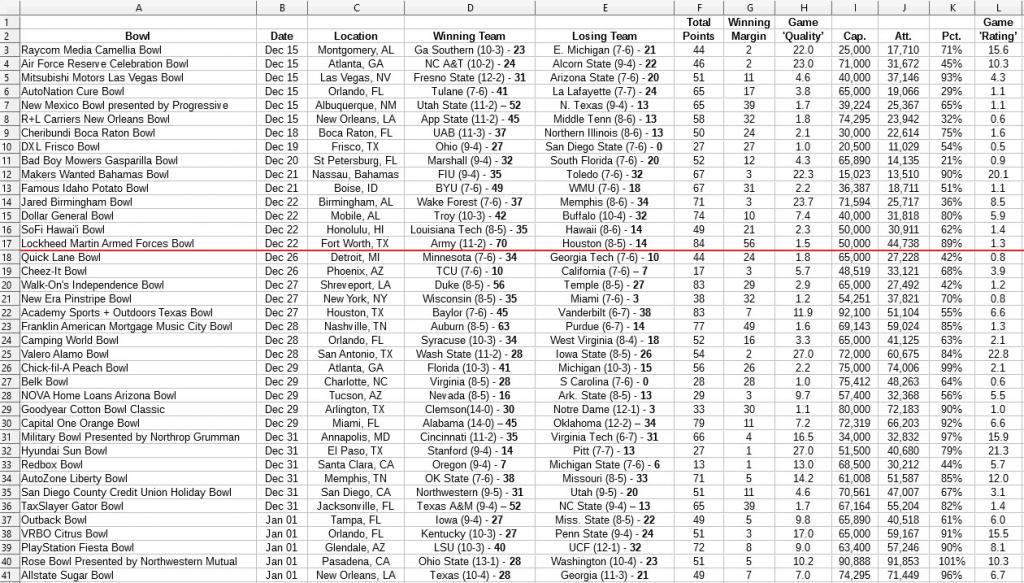
The Spreadsheet
Note: right click and "open image in a new tab" to view in larger format. Images here seem to be scaled to fit without the option to simply click and enlarge. Maybe I'm missing something.
Notes About the Spreadsheet
- The red line represents the dividing line between pre-Christmas and post-Christmas games.
- The "First Responders" bowl is not represented because it was canceled.
- I did not include the championship game.
- Team record shown is after the bowl game.
- Column H divides the total points scored by both teams by the margin of victory. The higher the number, the better: it means a close game with a lot of offense.
- Column K divides the announced "official" attendance by the stadium capacity to yield a "percent full" for the stadium.
- Column L is a game "rating" value. Let's discuss that next ...
The Rating Value
What I was striving for was a gauge of how good a game it was combined with the size of the crowd relative to the stadium capacity. The 'goodness' of the game was indicated by column H (total points scored divided by margin of victory), and the 'atmosphere' of the venue provided by column K (the percent full). My thinking was: a good game in a full stadium is a great experience; a good game in an empty arena is a diminished experience.
So column L is simply column H (game quality) multiplied by column K (attendance percentage). The bigger the number, the better. A large number means a high-scoring game with a close winning margin in a stadium venue that was mostly full. This approach rewards bowls in smaller venues that fill the seats, and it takes away from bowls in huge stadiums that are mostly empty. It's not perfect, but that's what I went with.
Pre-Christmas vs Post Christmas Bowls
When thinking about the bowl games, there seems to be a divide between the "lesser bowls" and the "better bowls," and that divide is Christmas day. The spreadsheet has a line indicating that divide.
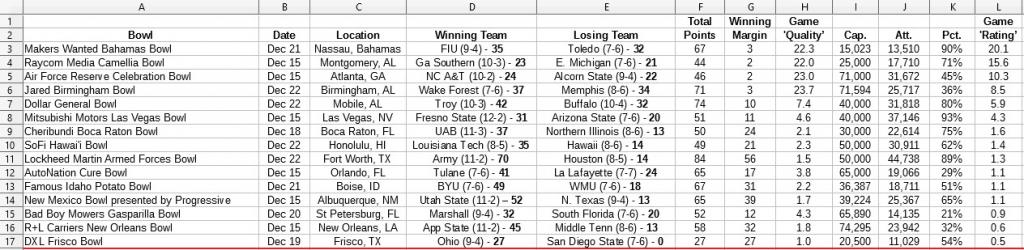
Here are the games played before Christmas, sorted by the game 'rating' value:
Note: right click and "open image in a new tab" to view in larger format.
Pre-Christmas 'best' bowl by this rating system: the Bahamas Bowl, where FIU beat Toledo 35-32. A close game in venue that was filled to 90% of capacity. However, it was a small venue to begin with, but maybe that's good: it was a 'lesser' game, so it didn't warrant a big stadium.
Pre-Christmas 'worst' bowl by this rating system: the Frisco Bowl, where Ohio beat up on San Diego State 27-0 in a half-full stadium that wasn't that large a venue to begin with. The game 'quality' math punishes a shutout game: total points (27) divided by margin (27) yields a quality of 1, which is the lowest possible given this math.
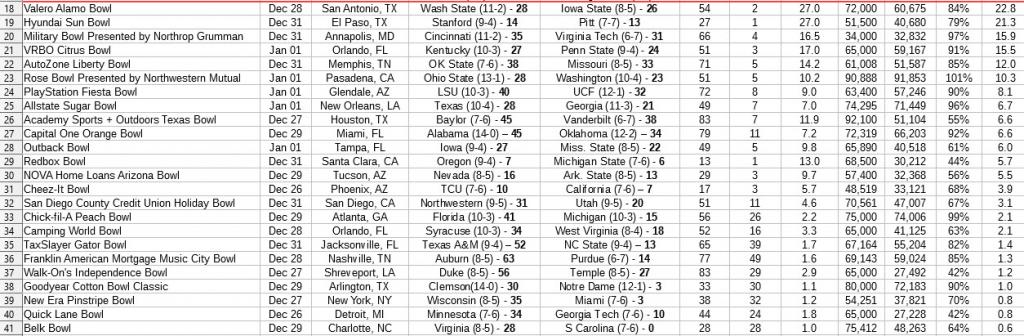
Here are the games played after Christmas, sorted by the game 'rating' value:
Note: right click and "open image in a new tab" to view in larger format.
Post-Christmas 'best' bowl by this rating system: the Alamo Bowl, where Washington State nipped Iowa State 28-26 in a stadium that was 84% occupied.
Post-Christmas 'worst' bowl by this rating system: the Belk Bowl, where Virginia's 28-0 spanking of South Carolina yielded a 0.6 game rating. Decent crowd (64% occupied), but the 'quality' math treats a shutout harshly, with the game quality number a meager 1.0.
Numbers Aside: Best and Worst Games
This is subjective, of course, and the comments can be used for feedback on reader feelings about best and worst games.
One game that surely must go in the 'worst' column is the MSU vs. Oregon game. Despite the math of this spreadsheet granting a game rating of 5.7, which was just below average for the post-Christmas games, the game was nearly unwatchable.
Best game? This one is tough because I didn't watch every game. My bias will be towards those I did watch. The Rose Bowl was entertaining. I found the Alabama/Oklahoma game interesting from a "can the Alabama machine be stopped?" perspective.
Column MIN, MAX, AVG, and MED
Here are the minimum, maximum, average, and median values for each column in the spreadsheet:
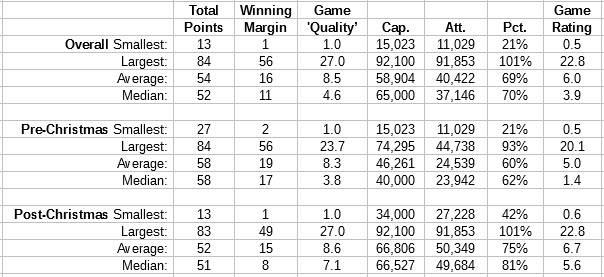
The games after Christmas were definitely better-attended, as expected. But the total points and margin-of-victory numbers are comparable. The early bowl games can provide entertaining football. Provided you care enough to watch.
Correlation Studies
Was there a correlation between the "game quality" value (column H) and other factors?
Note: this is really an exercise is creating charts and bitmaps and having fun with pictures. No serious statistical analysis was attempted here. :-)
Game Quality compared to Stadium Capacity
Did the bigger venues result in better games?
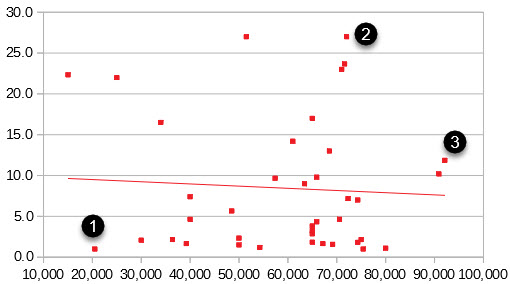
Notes:
- Ohio 28, SDSU 0
- Washington State 28, Iowa State 26
- Baylor 45, Vanderbilt 38
If anything, there's a slight negative correlation.
Game Quality compared to Stadium Utilization
Did attendance as a percent of stadium capacity correlated with the quality rating?
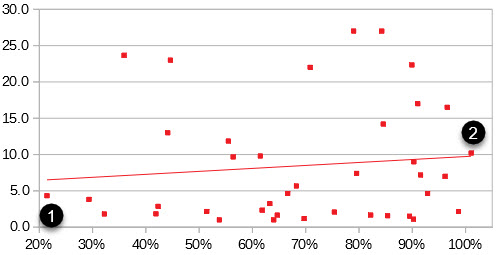
Notes:
- Marshall v South Florida in the 'Bad Boy Mowers Gasparilla Bowl'
- Ohio State v Washington in the Rose Bowl
A bit, but the correlation is very weak.
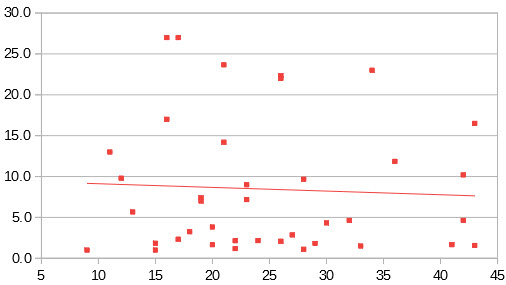
Game Quality compared to Latitude of Host City
I'm starting to have a little fun here. Latitude is a measure of how far north a city is, so I checked correlation of game quality against latitude:
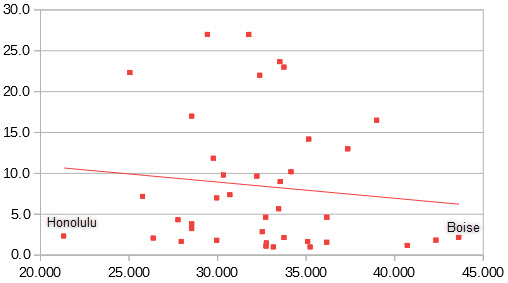
A bit of a negative correlation. But I doubt that has anything to do with where the host city is located.
Here's a map of the bowl locations:
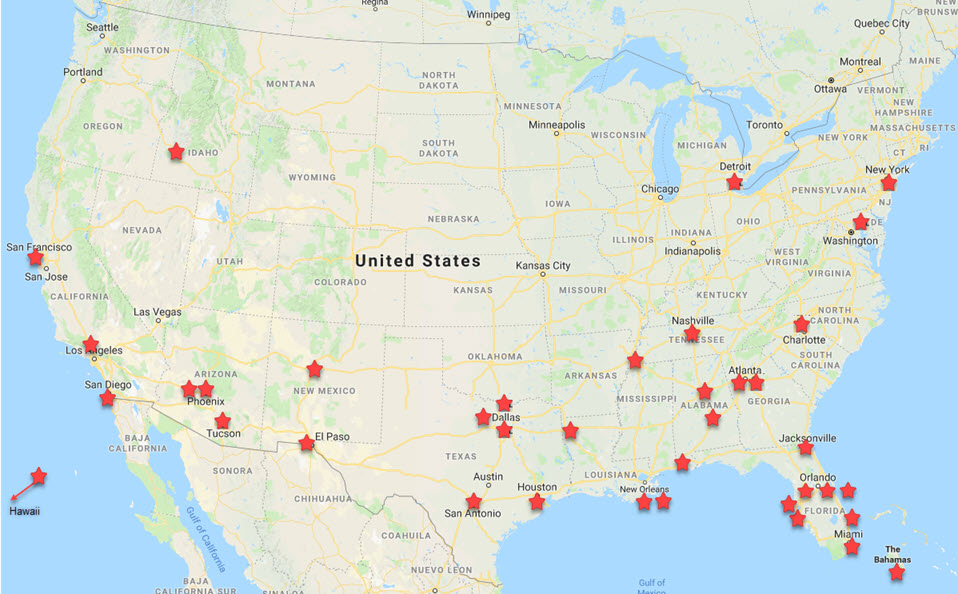
The distribution of the bowls location by latitude worked out like this:
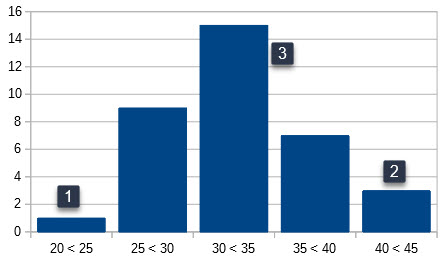
Notes:
- The Honolulu Bowl, which was the farthest south and the farthest west. The farthest east was the Bahamas Bowl.
- New York City, Detroit, and Boise. Boise was the farthest north bowl.
- Draw horizontal lines through New Orleans and Memphis ... 15 bowls were played in that band of latitude.
Cities with the most bowls: Orlando with 3, and the Dallas area with 3; Atlanta and New Orleans tied with 2. Florida is the most represented state for bowls with 8 bowls.
Game Quality compared to Character Length of Full Bowl Name
Now I'm really having some fun. The longest bowl name was the "Military Bowl Presented by Northrop Grumman" (43 characters, including spaces) on December 31st, between Cincinnati and Virginia Tech. It turned out to be a close affair: 35-31 Cincinnati over VT. The shortest name was the "Belk Bowl" (9 characters) on December 29th between Virginia and South Carolina. That was a shocking 28-0 blowout by Virginia. Was there an inverse correlation between the length of the bowl name the quality of the resulting game?
Wasn't really expecting one; didn't see one.
Game Quality compared to Random Number
Because, why not? I generated a random number between 0 and 1 for each bowl game and looked for a correlation:
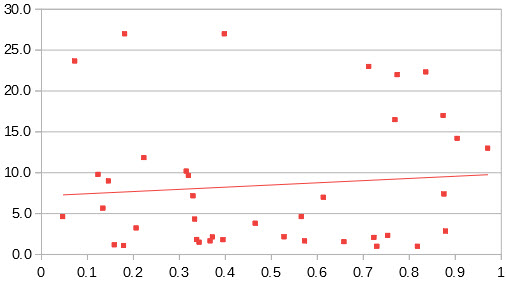
That correlation line moves a fair amount with each generation of random numbers. I don't think 39 data points is enough to allow the 'random' numbers to yield a flat line every time.
Thoughts About this Exercise
- I freely and fully admit the game 'quality' and 'rating' values are somewhat arbitrary. I think the game 'quality' (total points divided by margin) is an okay measure of game excitement, but it has its flaws (see MSU vs. Oregon); the game rating where the quality rating is multiplied by the attendance percentage is not that useful.
- I wanted to find a simple-to-locate stat in the box score of each game to further refine the game quality value. In particular, I wanted to find something that would explain bad games that I could use to push down the rating of a game that received an otherwise not-bad rating number. I thought about turnover differential, number of punts ... even total penalty yards. But I gave up after trying to find out why Ohio beat SDSU 27-0. See the next section for that exercise.
- I expected to see lower attendance figures in general, but the announced numbers are not horrible. But then again, these are the "reported" attendance values. I suspect actual butts-in-seats was quite a bit less for some bowls.
- Some of the attendance numbers I pulled from Wikipedia right after the game concluded. It's amazing how quickly those pages are created and updated for these bowl games, with data filled in specific to the game that finished just minutes before.
- There's a lot of bowl games. 39 is a big number. The payouts for many of these games are not trivial amounts. I don't know how they make money, or even if they make money. The business case justification for some of these baffles me.
Ohio vs. SDSU Box Score
As mentioned, I was tempted to dig into the box scores and factor in other numbers to weigh the quality of the game. I thought about numbers such as: turnover differential, total yards differential, rushing yard differential, and third-down conversion differential. But I abandoned that when I dug into the 27-0 blowout of SDSU by Ohio in the Frisco Bowl. Based on the score alone, I figured Ohio dominated in some way, or SDSU committed a ton of turnovers or penalties. The box score didn't show anything obvious: there's a bit of an imbalance in total yards, but it's not horrible. The turnover numbers are even, and the third down conversion rate was comparable:
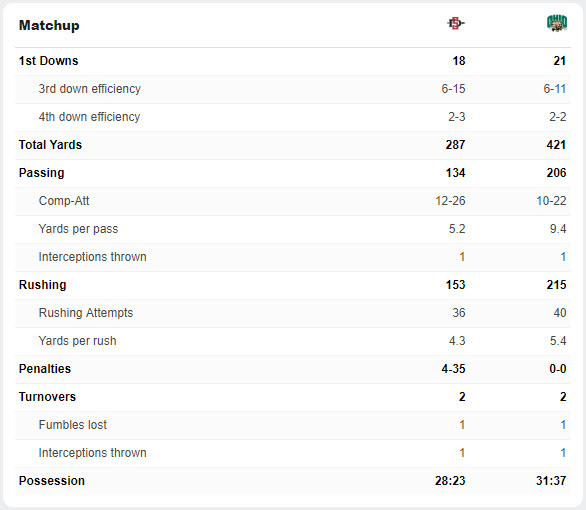
So I'm a bit puzzled why SDSU lost so badly. I didn't see the game, so I can't factor in qualitative things.
My conclusion: if the box score from a 27-0 blowout didn't have flashing red lights about the nature of the game, then other box scores might not either. Sometimes the numbers don't directly reflect what happened on the field. Rather than spend the time digging for a universal "X factor" stat, I went with my simple approach.
The Arizona Bowl
This was played on December 29th in Tucson, which is where I live. It pitted Arkansas State against Nevada. The final score was 16-13 in overtime. The announced attendance was 32,368, but in talking with someone who was there a more realistic number was somewhere around 10,000 ... maybe 15,000.
This gentleman (Mike Lude, a spry 96 years old: he was AD at Auburn and Washington back in the day) said the game featured two very bad football teams, with linemen for both teams very large and very slow. It was a cold day by Tucson standards (in the 40's), so I'm sure a lot of the locals stayed home. I'd be shocked if many Arkansas State fans traveled to Tucson for this. Nevada fans could drive down (8 hours), or fly (Southwest has direct flights), but I don't know if many bothered.
I can't figure out why the organizers of this scheduled it for the same day as the national semi-finals. I can't figure out why the NCAA allowed this game to be scheduled on that day. This bowl is better scheduled before Christmas. Or better still, not scheduled at all. If you want evidence there are too many bowl games, then look at this game. It's been in existence since 2015. Tucson used to host the "Copper Bowl," but that morphed into the "Cheez-It Bowl" and moved to Phoenix.
Conclusion
There are a lot of bowl games; some are well-attended, some are not; some are good, some are not-so-good; they happen year after year, so someone is making money, but how they make money is a mystery.
Hope springs eternal ... when does spring practice begin?
January 2nd, 2019 at 8:33 AM ^
This was really cool. Proves out that some of that first week garbage needs to be cut. I have always been a fan of requiring 7 wins to be bowl eligible, but after looking at this spreadsheet, I would be good with 8 wins for P5 and 9 wins for G5.
I will be curious to see all the final ratings come in. Happy New Year, Don!
January 2nd, 2019 at 10:33 AM ^
It looks like there are only 8 teams which entered a bowl game with fewer than 7 wins. That would've removed only 4 bowl games. Of course, the other issue is with conference agreements, meaning that many have to stretch to 6 wins in order to fulfill their agreements.
Overall, if we got rid of 10 bowl games, that would be fine with me.
Just for fun, graph depicting number of bowl games per year going back to 1969. It had long-ish periods of relative stability (from 83 to 96, there were anywhere from 17 to 19 bowl games), but around 1997 is when the growth in number of bowl games really started taking off. 1996 saw 18 bowl games, 2000 had 25, 2002 had 28. Then in 2006, it went up to 32, then 34, 35, 39, and peaked in 2015 and 2016 with 41 (including CoFoPof).

January 2nd, 2019 at 11:16 AM ^
I read something that the NCAA has approved three more starting in 2020.
January 2nd, 2019 at 12:00 PM ^
Wow, that's crazy, but true.
I'm sure ESPN and FOX are pushing hard for these. Kinda makes some small measure of sense that Chicago is mentioned, given that the pinstripe bowl hasn't been an utter disaster. If they get a decent Big Ten team to play in Soldier Field in December when the Bears are on the road, that could actually be not terrible. Or Wrigley or Comiskey (sorry, US Cel.. oops, Guaranteed Rate Field).
Myrtle Beach, Charleston, Greenville, and another one in the Phoenix metro area? I guess the Carolinas want more than just the one bowl game, Arizona wants to overtake California for number of bowl games, and Chicago wants in on the northern exposure.
I think we're at 15 states with bowl games right now. States which used to have bowl games, but no longer, include Ohio, Kentucky, Nevada, New Jersey, Maryland, Washington, and Arkansas (although many of them were decades ago).
January 4th, 2019 at 10:21 AM ^
Charleston, SC would be a great destination. The stadium isn't huge but pretty cool to play at the Citadel I would imagine.
The Lowcountry Bowl
The Ghost Tours Bowl
The Seersucker Bowl (since NY has the Pinstripe bowl)
The, don't go looking for golf balls in that pond or a 'Gator might bite you, Bowl
January 2nd, 2019 at 7:25 PM ^
Shitty bowl games can be meaningless to fans, but for the people playing in them, it can be a pretty cool experience.
1) You get to travel somewhere, 2) you get some swag, and 3) you get to play a team you probably have never seen before. If you're lucky, you play a crappy team with that one dude who goes big in the NFL so you have a cool story for your friends and coworkers in the future.
These players aren't going to the NFL. The vast majority of them will be teachers, car salesmen, journalists, accountants, lawyers, doctors, engineers, etc. Who cares if the stadium is empty. Let them have nice things.
January 8th, 2019 at 8:36 AM ^
Who cares if the stadium is empty. Let them have nice things.
I can agree with this in principle except for all the hand-wringing over "what'll happen to the bowl system" when talk of expanding the CFP to 6,8, or even 16 teams comes up. It's already been demonstrated that the majority of these games aren't profitable for the institutions themselves, so if the fallout of making the CFP more inclusive and compelling is that Nevada and Arkansas State don't get to face off on Dec 29th, then so be it.
January 2nd, 2019 at 8:37 AM ^
How did that Peach Bowl work out?
/asking for a friend
January 2nd, 2019 at 8:42 AM ^
Below average, below median ... :-(
January 2nd, 2019 at 11:42 AM ^
But second best in attendance so they have that going for them.
January 8th, 2019 at 8:40 AM ^
I don't know what the payout for participating in the game was, but I'd not be surprised to find out we lost money playing that game.
January 2nd, 2019 at 1:39 PM ^
Would be yummy, but peaches are out of season

January 2nd, 2019 at 5:57 PM ^
Too bad they didnt get the Mackinaw peaches. Theyre only in season two weeks a year, but theyre like a circus in your mouth
January 2nd, 2019 at 7:29 PM ^
Trapeze sweat with a hint of clown tears and minced bearded lady? I'll have the variety that comes with extra elephant.
January 2nd, 2019 at 8:51 AM ^
Nice analytics Don & thanks for doing this...love reading metrics
January 2nd, 2019 at 9:01 AM ^
The two playoff games had 90% and 92% of their capacity? That alone should tell you there is a problem with the bowls.
Thanks for taking the entire month of December to compile this great info!
January 2nd, 2019 at 9:04 AM ^
Thanks for the interesting stats. My takeaways from your work is that with "announced attendance", 11 bowl games drew more the 50 K, just 6 games drew more than 60k, and just 4 games drew 70 k plus. Lower than I would have thought. For attendance, the Rose Bowl is still by far and away the Grand Daddy of them all drawing 91,853. Ticket prices may need to come down for better attendance at a lot of these games.
January 2nd, 2019 at 10:00 AM ^
If a 421-287 total yards discrepancy isn’t enough to tell you what happened, look at 3rd and 4th down stops. Combined, SDSU was 8-18 while Ohio was 8-13. SDSU had several more drives stopped, probably because they couldn’t gain yards.
January 2nd, 2019 at 10:14 AM ^
Take a look at the 28-0 drubbing Virginia laid on South Carolina:
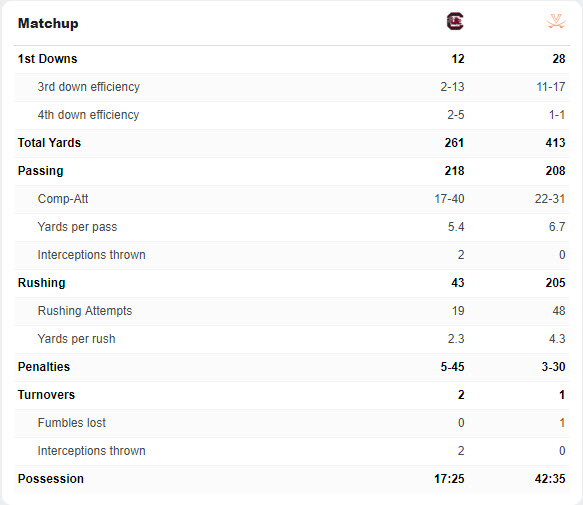
That's what I would have expected from a four TD shutout ... look at SC's 3rd down (2 for 13) and 4th down (2 for 5), rushing (only 43 yards), and interceptions thrown (2). Also, look at that time of possession discrepancy! South Carolina didn't have the ball much, and when they did have it they didn't do much with the time.
I see the point you're making about Ohio/SDSU ... the breadcrumbs are there to discern how the game went down ... but it's not as obvious as I expected. Hence my inability to find "that one stat" to include in my metrics to punish further bad games.
January 2nd, 2019 at 10:03 AM ^
I watched the Peach Bowl and that was it this year. Who wants to see another Clemson-Alabama game? Not me.
January 2nd, 2019 at 1:16 PM ^
Exactly, especially on a Monday night.
January 2nd, 2019 at 12:11 PM ^
There is no way there were 30k fans in the stadium for the Red Box bowl.
January 2nd, 2019 at 12:20 PM ^
Yeah ... I take those "official" numbers with a grain of salt. But that's all I had to work with.
If I were to guess, a "reduction factor" of 30% to 40% is probably in order for most of those games. Not the Rose, Sugar, or Orange, but most of the others.
For television, they try very hard to *not* show the empty seats.
January 2nd, 2019 at 10:22 PM ^
I get it. Thanks for putting the sheet together. It is pretty interesting.
January 3rd, 2019 at 10:22 AM ^
wow that was sad. it appears Oregon fans didn't even care. feel bad for the fans that did go witness that shit show.
January 4th, 2019 at 4:50 PM ^
It was a typo it was supposed to read 30 fans
January 2nd, 2019 at 12:40 PM ^
I attended the Vegas Bowl and no way in hell was there only 3500 people not there. You said there were 37,000 of a possible 40,000. I would bet there was only 25,000 max there.
January 2nd, 2019 at 12:52 PM ^
Nice work!
You might still consider the First Responder Bowl under the statistical principle of "intention to play" like "intention to treat" analysis. The teams showed up. The stadium was prepared. The referees were hired. They meant to play. That everything went down hill after 5-7 minutes, the prep work did happen and it should count against the statistics that are available. :)
January 2nd, 2019 at 3:38 PM ^
A lot of great info, thanks.
other than a fan of junk bowls would assume a lot of people who worked the stadiums appreciated the extra paycheck during the holidays.
January 2nd, 2019 at 6:28 PM ^
Thanks for doing this.
I’d suggest that ‘game enjoyment’ has a skewed U-shaped relationship with ‘game quality’. That is, really big blowouts can be enjoyable or at least memorable too—
Army over Houston
Wisconsin over Miami
Clemson over ND
January 2nd, 2019 at 8:00 PM ^
You know, there's something to this. Some games are great, some are bad, and some are so bad they're fun. What would the formula for that look like? What does that U shape look like?
Also, close games are not necessarily good games. Two games come to mind: 10-7 and 7-6.
Finally: any game in which Notre Dame is stomped on is a GREAT game in my book.
January 2nd, 2019 at 7:29 PM ^
I know one thing:
Bowl games are not meaningless to DonAZ!
January 2nd, 2019 at 8:51 PM ^
Like at the big house, attendance figures are bogus. Like stats man.
January 2nd, 2019 at 9:20 PM ^
"Bad Boy Mowers Gasparilla Bowl" has dethroned "Poulan Weedeater Independence Bowl" as the most ridiculous low-rent bowl name of all time.
January 3rd, 2019 at 12:00 PM ^
I gave serious thought to assigning a weighting factor based on the name of the bowl. It would have been completely arbitrary, of course. It was that thinking that led me to do the correlation based on bowl name length.
I suspect it's only a matter of time before they start assigning multiple corporate names to bowls. For example: "The Bad Boy Mowers and Scott Liquid Fertilizer Gasparilla Bowl Presented by Ace Hardware Your Place for Garden Supplies Bowl."
January 2nd, 2019 at 9:56 PM ^
I went to 3 bowl games this year. The Peach Bowl had the best attendance but still had a lot of empty seats, and yes the game sucked. At the Music City Bowl we bought the cheap seats from Ticketmaster but then the day before the game got an email saying we could upgrade to club level seats for $20, so for $50 each, we got to sit at club level. At the Liberty Bowl they had seats in the endzones (at least I assume there were seats there) covered up. We also met a young veteran with his two sons who had free tickets. He said they were offering free tickets to any veteran. All he had to pay was a $5 per ticket processing fee. Covering seats up, offering free tickets, providing inexpensive upgrades to move people down so the stadium will look fuller, and I'm sure there are a lot of other schemes that were used to get more people (or at least the appearance of more people) into the stadium.
January 2nd, 2019 at 10:26 PM ^
You should sell this data to all the bowl committees and make yourself a pretty penny. Nice work. I appreciate the time you spent to do this.
January 3rd, 2019 at 1:31 AM ^
Liked the Kentucky-PSU game perhaps the most, followed by Texas-Georgia. Both had fans from both teams, mostly full stadiums, belated and failed comebacks by the favorites, and overall pleasing to watch.
Also watched the Iowa-MSU game. Good game. Was shocked the crowd size was done. Two teams that should travel with 20-30 thousand fans plus enough locals to fill the place. That was an 80-degree sunny day too.
January 3rd, 2019 at 2:17 AM ^
Mentariworks merupakan situs judi bola online yang sekaligus berperan sebagai Bandar Bola online resmi dan terpercaya yang ada di Indonesia, dimana sudah mempunyai ratusan member aktif setiap harinya. Selain dari pada itu juga Mentariworks melayani pembuatan akun judi bola online secara gratis bagi para pecinta judi bola online yang ada di Indonesia.
January 4th, 2019 at 11:02 PM ^
Perhaps a plea for a Bowl game in Indonesia?
January 3rd, 2019 at 9:07 AM ^
Great stuff. I'm going to keep that spreadsheet filed away for the next time a Sparty complains about how the media loves Michigan and Michigan always gets the benefit of the doubt in the polls (both of which are debatable, but they still say it). Perhaps if they could fill their bowl to greater than 44% capacity it would help.
January 3rd, 2019 at 3:01 PM ^
this is very nice analysis - well done!
but there has to be a salt lick around to account for all the grains you have to take with the attendance figures. I was at the Peach Bowl, in the new Benz stadium - and NO WAY was there 74000 in there. i was in there for the MLS Cup (#ATLUTD) and that place was jammed, and rocking, and attendance announced at an MLS record 73,000 and change.
at the Peach bowl, i could clearly see empty seats everywhere, and during first quarter guessed to those around me 35-40k at best. no chance it was 74k, even if you count all the concessions, media and security people (like the University does in AA).
i bet that except for CFP and maybe the Rose Bowl, you could cut all of these attendance figures in half...i guess that would just apply an offset bias to all of your charts, but still....
January 3rd, 2019 at 3:34 PM ^
Some of the "announced" attendance vs. the reality is all of the tickets that universities must promise to "sell" in order to participate in the bowl but they have to eat at a loss when fans don't want to buy them.
These ticket guarantees is what has to keep some of these games afloat year after year. This is a few years old, but still relevant.
January 4th, 2019 at 1:23 PM ^
I was at the Famous Idaho Potato Bowl. NOT at that game was anything close to 18,000 people. I suspect it's no different than regular season games: They are counting every ticket disbursed in any way and every warm body within a quarter mile of the stadium as an "attendee". The number doesn't reflect in any way the number of paying fans who entered the stadium and watched the game.
January 4th, 2019 at 1:40 PM ^
Less is More
January 5th, 2019 at 9:01 PM ^
Nice analysis! Interesting to see there were quite a few games at higher capacity than the two playoff games!
January 7th, 2019 at 4:02 PM ^
Hey, I liked the Belk Bowl.
But I'd add to the above points: no way was the stadium 64% full. Maybe half, but probably not. Surprising as hell, because I went to that bowl 15 years ago when it was called the Continental Tire Bowl, and it was pretty full. You'd think UVA and USC-e could fill that place better than they did.
January 8th, 2019 at 10:10 AM ^
My wife -- also a UVA alum -- liked the outcome of the Belk Bowl. :-)
In an ideal world we'd have someone at each stadium to offer a "real attendance" factor. In the comments here we've heard from a few ... and universally the answer is "actual was a lot less than announced."
January 8th, 2019 at 11:56 AM ^
I guess if every single bowl is in reality less than the announced attendance, might as well just roll with it.
I would add, for the OP, that it might be worth taking margin of victory and dividing it up by quarters. The Belk Bowl is a great example why. OK, at the end of the game it looked like a dominant performance. At halftime, though, it was only 14-0. Still anyone's game. The entertainment factor of the game is much higher than it would've been if it were 28-0 at the half and the second half was just a coast to the finish. It's only looking back that you go "huh, that wasn't a close game." During the game, though, more drama than you'd think from the final score.
Comments