Michigan's offensive regression, part II: 2011-2013

In my last diary, in which I tried to chart Michigan's offensive regression over the season, Gandalf the Maize suggested that I track Michigan's offensive performance over the course of the past three seasons. That seemed like a good idea.
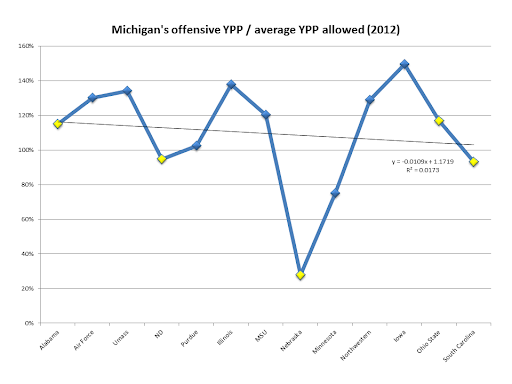
For this diary, I only used one statistic: Michigan's offensive yards per play (YPP), which I then divided by the average yards per play allowed by that team over the course of that season. So, for example, Michigan averaged 7.38 yards per play on offense against Western Michigan in 2011, and 6.63 YPP against Ohio State. But Western allowed 6.1 YPP on defense over the 2011 season, whereas Ohio State allowed only 5.06 YPP. That means that our offensive output against Ohio State was more impressive (131% of their average YPP allowed) than our output against Western (121%).
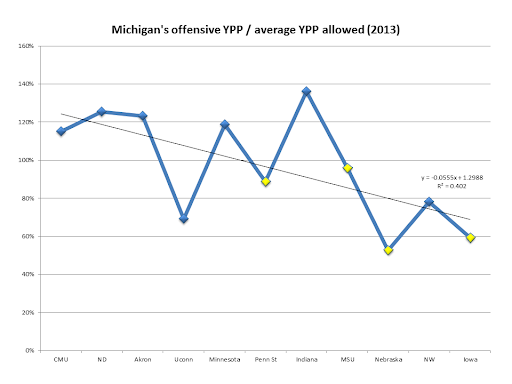
Note: the black diagonal line is the trendline. Maize dots indicate losses.
Here are the charts:

And, all three seasons in one chart:

Notes:
-
There is offensive regression in each season. As Gandalf pointed out, this is sub-optimal.
- It is most pronounced this season, of course.
- In 2012, it is the least pronounced; I took out the Nebraska game and the trendline was still slightly negative (y = -0.0063x + 1.205, R² = 0.011).
- The 2012 Iowa game was Michigan's best offensive output over the past three years by this metric. For those who forgot, that was the game where Devin played QB and Denard returned as a RB. Devin was 18/23, 314 yds (13.65 yards per attempt), and Denard rushed for 98 yards on 13 rushes for an average of 7.5 yards per rush.
- The 2012 Nebraska game was, unsurprising, the worst offensive output over the past 3 years. I don't think anyone needs to be reminded about that game.
I'm not sure how to diagnose this overall trend. Borges running out of ideas? Our quarterbacks getting banged up? Cold weather? On the other hand, perhaps it's not terribly significant -- the slopes for 2011 and 2012 are only slightly negative, after all.
November 26th, 2013 at 9:30 AM ^
It does appear that the first two years the trendline seems relatively flat overall (slightly down with extremes like Nebraska, but generally with a trendline hovering just above the 100% number). I guess what I'm interested in is how other teams fair in this category, ie, is the trendline for most offenses somewhat downward as defenses start figuring out tendencies, the majority of plays, get into conference play, etc. Obviously, a team like MSU this year doesn't see that, but it feels like for the most part, especially with Michigan for the past 6 years, the offense has always been generally better looking to start seasons and then production has slowly tapered off as defenses started figuring things out.
It would just be interesting to say, take the last 3 years (or 5 or 6 or whatever) and look at trendlines in single seasons of other teams, and see how that linear slope compares. My guess is that Michigan has a more negative slope than most other teams (I have my reasoning for why I beleive that is), but my feeling is that you'll likely see, as a whole, B1G teams with negative slope in their linear trendline (my guess is somewhere between the 2011 slope and 2013 slope, likely closer to the 2011 slope).
EDIT: an easier method would be just to look at 2013 season and look at the B1G as a whole. You can see the trendline of each team and then average them together to get a trendline for the entire B1G, possibly with the all the teams stacked behind that averaged trendline. I actually think that would be a more effective approach for you, as it would show how far this year is from the norm.
November 26th, 2013 at 9:33 AM ^
and a sensible next step to take, assuming that people think this way of looking at offensive production is sensible. I'll give it a shot next time I've got some free time. Doing 3 Michigan seasons doesn't take a lot of time... the whole B1G will take a little bit longer.
November 26th, 2013 at 9:49 AM ^
Because it does depend on a lot of other things and some teams (Stanford for instance) aren't as designed for big plays as other teams. That said, without going crazy into advanced metrics, all plays are still designed to work, and I can't think of a better thing to look at that than YPP vs the average given up by a team. So in that sense I think it's a very good way of looking at it.
FWIW, a lot of coaches look at it as a level of success. I've seen a couple ways of doing that, such as picking up half or more of first down yardage (or a 1st down on 3rd or 4th down). I've seen it broken into 4+ yards gains on runs is a successful play. I've seen it broken into positive, neutral, negative plays (which utilizes some sort of formula to distinguish the three). All of those are cute and somewhat subjective and would be very annoying and time consuming to try to do. So I think you are taking the correct approach here.
November 26th, 2013 at 12:16 PM ^
i'd love to see how all the offenses that borges has coordinated in his career have fared in their third year. it would really suck if they looked like the chart for michigan this year...
November 26th, 2013 at 10:20 AM ^
I think I agree that more likely than not, most teams would see their trendlines heading slightly south over the season. As much for the typically soft early season schedules as for anything related to opponents better understanding play tendencies or everyone generally getting into the meat of their schedule late in the season. (Northwestern and Wisconsin played OSU fairly early in their B10 seasons, for instance.)
What's most striking to me about these three seasons isn't so much that the 2013 season has a steeper negative slope (though that's not good either), but that the 2013 season is the only one whose trendline results in sub-average territory (by a lot). It doesn't seem unusual that teams would have a variety of issues depressing offensive output late into the season, but for Michigan to end up so far below the average of it's opponents' outputs (if I'm understanding these values/charts correctly), that's a big issue for me. 2011 looks to be about average (ending around 100%); 2012 a bit better at about 105%; but 2013 is horrid at around 70%).
I'm sure using trendlines as an averaging of our offensive output isn't so scientific, but the graph is telling of (something bad), nonetheless.
November 30th, 2013 at 5:34 AM ^
I believe a defense analysis next to the offensive output would give a better trend of overall output and where this team is going. If we're able to win with less O. output and a better D i'd still be fine with this.
November 26th, 2013 at 10:06 AM ^
Kinda funny that our rating for the Bama game was higher than for the SC game.
Or Purdue. Actually, that's funnier.
November 28th, 2013 at 7:16 AM ^
Of course Alabama is a team that even sloppy tends to win games.
November 26th, 2013 at 10:13 AM ^
November 26th, 2013 at 11:04 AM ^
Yeah, this was my thought. This is awesome work, but I wonder what kind of impact the EMUs, WMUs, SDSUs, and Akrons of the world have on offensive numbers.
November 26th, 2013 at 12:59 PM ^
Most of these charts is completely expected with regards to the schedule: we play tougher teams late and usually our toughest game of the year is the last one.
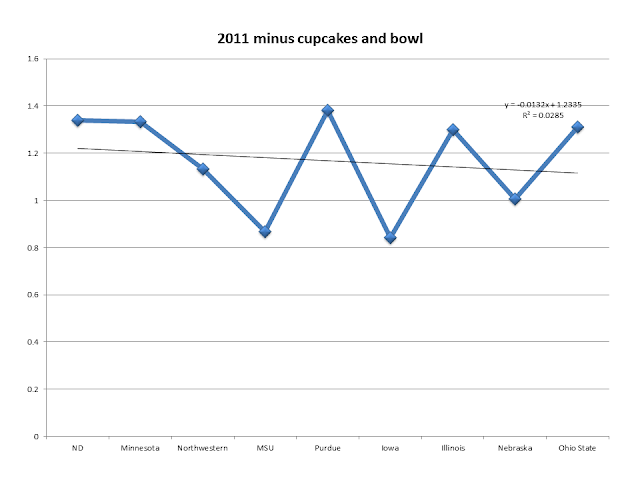
I'd be interested to see the stats with the cupcakes removed.
I really don't see any distrubing trends here.
November 26th, 2013 at 1:08 PM ^
Our offense is going through a stretch that is literally among the worst 1% of month long stretches in CFB in the last 6 years and you see nothing disturbing?
November 26th, 2013 at 3:22 PM ^
I've also left a gap between each season so that's a bit more clear.

November 26th, 2013 at 10:18 AM ^
November 26th, 2013 at 10:21 AM ^
The data seem too noisy to draw conclusions from regression lines, but that doesn't mean there's not a narrative here. Not to throw more work on you, but seeing the week-to-week variance from other teams would help understand if swings of 20% are typical.
My interpretation of 2012 would be that something awful happened against Nebraska (I must have blocked that from my memory) which carried over to Minnesota while we tried to adjust, but then we returned to our previous level of production, so a relatively constant output across the year. 2011 looks roughly constant until a bad outing against SCU, when the injury to Molk was important.
The data from 2013 suggest splitting the season into before and after MSU; roughly constant decent output beforehand (UConn who?) and constantly bad output afterward. That's significantly different behavior than you see in 2011-2012, when we still have strong production against OSU.
Is this because defenses suddenly picked up on something that they weren't able to see in 2011-2012? Devin's ribs finally losing the last of their solidity? Impossible to say.
Keep up the cool work!
November 26th, 2013 at 10:29 AM ^
was that Denard got injured in the Nebraska game and we put Bellomy in. When that was an abject failure, Gardner was pulled from the WR corps and put in at QB against Minnesota. Gardner played well enough: 12/18, 234 yds, 2 TDs, 1 INT, 21 yards rushing, 1 rushing TD.
I agree that linear trends aren't really the right approach -- they are more a radical simplification of the data for me.
November 26th, 2013 at 10:31 AM ^
In both years UM has outdone the average performance against OSU. Say Borges goes all Debord Capital One Bowl on OSU and Michigan is again in that 100-120% range this weekend-- likely putting Michigan in position to actually win the damn game. We hate him more, right?
Thanks for the work as always dnak. Your comparative stats really help solidify the ol' eyeball test each Saturday.
November 26th, 2013 at 10:34 AM ^
So my shares of UM offensive stock I purchased in 2011 aren't doing well?
November 26th, 2013 at 11:49 AM ^
Just call up Dave Brandon and have him bail you out.
November 26th, 2013 at 10:47 AM ^
what's most disturbing about this is that his first two years borges had the RR players and system and even though he claimed that he wasn't comfortable with it, did quite well. with more borges-type players and system, he actually does dramatically worse. that's no reason for hope for the future.
November 26th, 2013 at 10:58 AM ^
First, he's offense improved in year 2 with fewer RR players to degree. 2nd, in 2013 most of "his" players are still very young.
Ultimately, your conclusion may be correct. It could also be that this year is an anomoly based on other factors. To me, based not only on the 2013 chart but also on watching the games, an extreme weakness that is extremely difficult to mitigate got exposed, oh, somewhere around the MSU game.
So, while I'm not saying you're wrong, I do not think you can jump to the conclusion you are jumping to based on the information that is presented here.
November 26th, 2013 at 11:57 AM ^
of course there could be other factors. no one could ever prove that one factor or another is principally responsible for the regression. but what's frightening is that he is now using the system he claims to specialize in and it's far worse than when he used the system that he purposefully tempered expectations for.
also, the previous two years had the "denard, do something" factor. this doesn't.
November 26th, 2013 at 10:48 AM ^
It seems now that the only rational thing left to do is fire Al Borges after this season is done. He's got two more chances to prove himself but frankly nobody believes that he will get better.
November 26th, 2013 at 10:49 AM ^
I think one thing that might help with interpretation of the graph would be to highlight the 100% line somehow. In this analysis, if I am reading correctly, 100% = average performance. While the trend is downwards throughout, there are a significant number of games in the 1st 2 seasons which are over the 100% mark which means they did above average against that opponent.
November 26th, 2013 at 11:46 AM ^
I think you're trying a bit too hard now. The R^2 of 2012 is basically nonexistent -- no offensive regression -- and in 2011 the early cupcakes are plenty to explain any "trend". Plus I bet if you take out the poor performance against Virginia Tech the trend goes away entirely. As you'll agree, a single outlier does not a trend make. The trend in 2013 seems real, to at least some extent, but the data are so noisy I wouldn't put too fine a point on it.
It seems to me that offense this year is just bad, and that a "regression" over the course of the season is a superfluous argument, and not necessarily due to Borges anyway. I won't be sad if Borges gets the sack, but regression isn't why.
November 26th, 2013 at 7:23 PM ^
Well done. So yeah, the trend disappears. It's really just a 2013 problem.
November 26th, 2013 at 12:30 PM ^
I find this interesting, so I took a look at the YPP of each Big Ten team over the course of the season (by month, as they don't have individual game rankings, unfortunately)
Team Aug/Sept Oct November %Nov/A|S
OSU 6.72 7.13 8.70 129%
MSU 4.65 5.58 5.67 121%
Wisconsin 7.73 6.88 6.45 83%
Minnesota 5.53 5.15 5.58 ~101%
Nebraska 6.34 5.92 5.01 79%
Iowa 5.68 4.99 5.53 97%
Michigan 5.95 6.83 3.26 54%
Penn State 6.21 4.52 5.79 93%
Indiana 7.15 6.15 6.08 85%
Northwestern 6.57 4.84 4.34 66%
Illinois 6.81 4.84 5.63 82%
Purdue 4.56 3.68 4.06 89%
Mich08 4.54 4.44 4.31 94%
So it would appear that using this metric, generally teams perform better earlier in the season, more than likely when the schedule is at its easiest. However, only one team completely falls of a cliff with no real reason (Northwestern has suffered a host of injuries, Michigan's offense has remained remarkably healthy) and that is Michigan.
From 2008 to 2013 here are the teams that have averaged worse YPP for a month than Michigan in 2013's November:
UCF & Washington State October 2008
Florida Atlantic & Kent State September 2011
Kent State October 2011
Akron November 2011
Tulane September 2012
UMass October 2012
Miami(OH) & Florida International September 2013
Ohio & Wake Forest November 2013
Here's the truth: Michigan's offense is bad right now. Historically bad. We've entered territory only a dozen of teams over the past 6 seasons have been in and we've still got our most difficult game of the month to play.
What does this all mean? Well, we all know what we're arguing: Should Al Borges be fired or not. When you look at what this offense has produced and your only excuses are "the interior of the line is young" and execution, you haven't brought enough ammunition to win this shootout. Its clear that there is something else wrong with this side of the ball and a full makeover is in order from the top on down when it comes to the coaching staff.
November 26th, 2013 at 12:56 PM ^

Here is a slightly different view of the same data. Removed non-B10 (except Notre Dame, a de facto B10 member). Blue used for positive values (above 100%), red for negative (below 100%). Numbers just eyeballed from data collected above, and 100 subtracted from them to get the positive/negative scale*. Wins/losses not shown (though remembered).
One might look at this and actually conlude as follows: 2011 and 2012 were fine, modulo Denard getting hurt. This actually kind of makes sense - remember how close that OSU game actually was last season.
2013, on the other hand, looks like we plain forgot how to play offense. Not sure how to explain it. Yes, O-Line is young but...
Oddly, this made me feel more positive. One bad year, and some frustrations sprinkled in here and there otherwise. And there is one more game left....
------------
* Perhaps should scale the less than 100% ones differently, as getting 50% is actually 2x worse than expected, but oh well.

November 26th, 2013 at 4:51 PM ^
Minnesota is another Big 10 team that started with a new coaching staff in 2011.

Their offensive YPP compared to their opponents' average YPP has remained fairly constant, on average.
November 26th, 2013 at 6:45 PM ^
Al Borges at Auburn:

Looks painfully familiar.
OK, I'm done. I promise. :)
November 26th, 2013 at 6:52 PM ^
I think all these comparative data can be really useful, and it's hard for just one person to do it.
November 28th, 2013 at 10:04 AM ^
This is really interesting! Thanks to everyone who's done the comparative / contextual work as well. That stuff really helps. My gut reaction is that things aren't that bad...except for the last four games where things have COMPLETELY FALLEN APART. With cupcakes excised we've still got more above the break even line.
Is it encouraging that we're still generally above the line? Or discouraging that the second of this season is a tire fire? I don't know. Both?
Does anyone else just wonder why we couldn't have RichRod but with a Mattison DC? Beating a dead horse, I know, but man. I mean there's a decent change RR and BH end up with the same record in year 3, except RR was trending up after getting his own players and BH is trending down after doing the same. Why can't we have nice things?
Comments