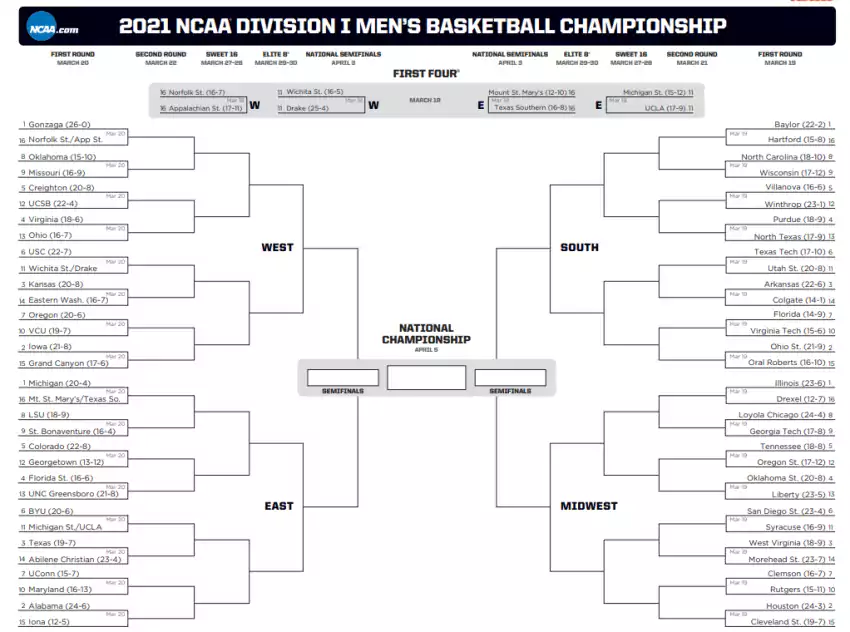
Seth's 2021 Bracket Assist Tool

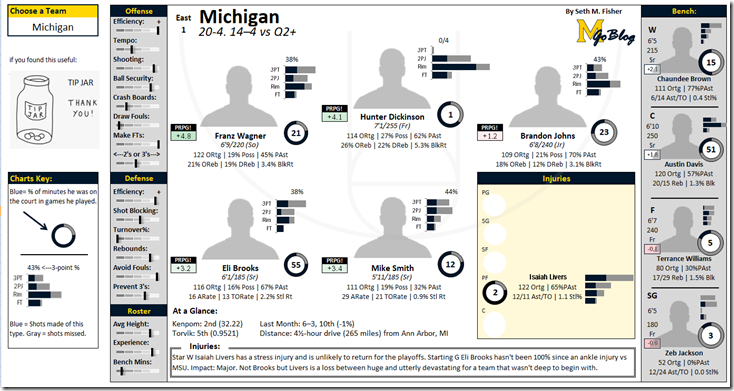
I didn’t get to make the bracket widget last year so this year I went a little overboard: For those of you who still have Excel, you can now make your very own Sethchart! Put in the name of the team you want to look at, and it’ll show you the lineups and injuries and player data including the shot charts.
Google Sheets has a hard time converting the pretty charts so you really need Excel for it, sorry. If one of you has the capability to convert these better please let me know and we'll make that available to the gentry.
I suggest taking some time to familiarize yourself the shooting charts, which show shot type and volume (specifically shot equivalents per 30 minutes) because that will show you quickly where a team’s scoring comes from and what kind of player each guy is. Usage (%Poss) also lets you know who’s driving the offense. PRPG! boxes are color shaded—they’re not perfect but they’re decent at picking out which players are problems for the opponent and which are problems for the team.
I also made the traditional Bracket Assist tool so you can compare two teams at a glance. I highly recommend making your own copy so you can click around at your leisure.
Most of the data are from Kenpom and Torvik, with the injuries from a combination of lists, Kenpom data, and googling that resulted in ad-blasted local papers behind a paywall. Distance factor was calculated by putting the schools' addresses into Google Maps (I have a tool). The shot charts are data from Hoop-Math.
After THE JUMP: ten basketball tools I use
--------------------------------------------
Ten Online Tools
(Much of this was republished from 2019)
I don't recommend just my little comp tool. You should learn a thing or two about each team and think about their matchups. Take a team like Iowa: they play a lot of zone, their defense is bad because their center is atrocious at it, and they murder you with outside shooting. If they're playing a team that takes away the three and scores a ton in the post, you don't want Iowa.
1. KENPOM. The gold standard, somehow even more useful, but no longer a secret known only to bloggers and stat-heads. I don't know how this isn't a homepage on your phone already. Ken Pomeroy uses tempo-free stats to pare down to predictive efficiency metrics. It's great for sweeping generalities, but doesn't account for situations teams find themselves in. For that you can turn to…
2. BART TORVIK. Let's peel off whatever we want to from the Kenpom stats and see how that changes things. Then let's make a graph out of it. Torvik's site is for the real nerds, but he's got loads of pages that simplify bracket questions like "What's this coach's recent tourney results versus expectations?" Another other extremely useful bracket tool on Torvik is "Similar Resumes." Last I like his Team Bubbles Chart, which I can play around. For example try just High Major teams versus Quad 1 opponents (wish the bubbles could represent # of games charted but Torvik Wish Lists are part of the Torvik experience. If all this sounds like too much math and you just want someone who can summarize this easily, try…
3. THE POWER RANK. You know Ed Feng, the guy whose chair I stole from the MGoBlog Roundtable on WTKA. This stuff is wheelhouse; in fact he literally wrote the book on it. Non-members are restricted to his standard "TPR" (the power rank) metric, which is based on team rankings, margin of victory, and strength of schedule, and spits out a predicted margin of victory over an average (read: ~160th) opponent). His turbo stat is based on how teams performed based on their Vegas odds, which is great because those take into account EVERYTHING—like who was not full-go that night. To entice signups he often leaks some of the more interesting predictions this spits out so he's a good tourney time follow. If I was a better friend I'd be on his site more often, but honestly I spend a lot more time on…
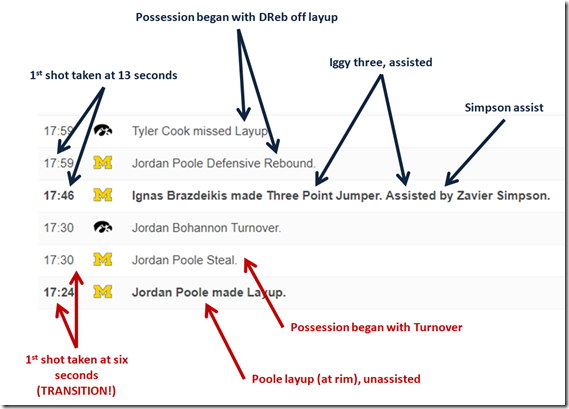
4. HOOP-MATH. The owner is Jeff Haley, the Seth of Burnt Orange Nation (the Longhorns blog), and his stats are produced from play-by-play data. I know because he's slow to update the data so I usually have to update opponent pages myself to include the last game. Here's how he gets his stuff:
Some find/replace and formulas converts that to a spreadsheet:
This is how I get my "At the Rim" and "Percent of Points Assisted" stats that you see on my charts. Or at least, this is where I get the raw data to produce those. Brian is on Hoop-Math every preview so he can tell you things like "this team gets half their shots from transition and triples their eFG% so shutting that down is a priority."
It's a great site for finding hidden upsets, especially for subscribers, who can download the data and get access to additional boxes like late offense and individual shot blocking at the rim versus at large. Are they a transition-reliant team facing an opponent that doesn't turn it over? Are they a mid-major with a big taking a ton of unassisted shots at the rim facing an elite defensive center? How bad are they when their banged up SG gets in…waitaminute, now I'm getting them confused with the similar layout of:
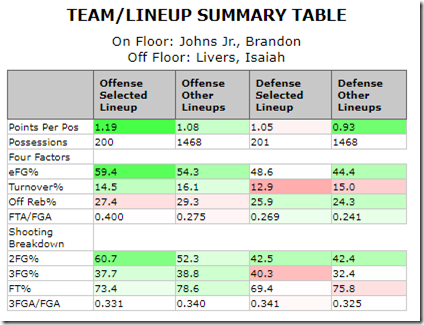
5. HOOP-LENS. This is a paid (not expensive) service for breaking down individual players, and well worth your while for the fun to be had from turning your work's instant messaging channel into a wall of splits. Brian wrote a post on How to Hoop Lens this year.
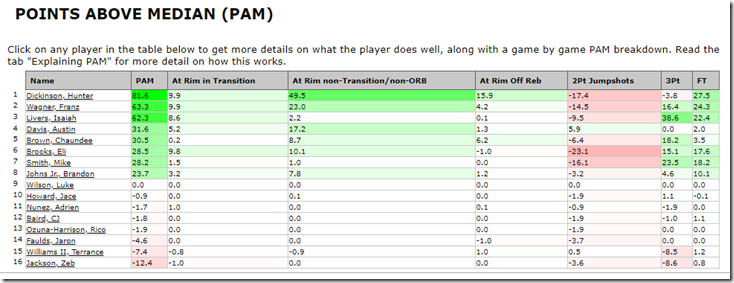
This is useful for (sigh) looking at the impact of an injured player, eg how Michigan’s defense goes from elite to just pretty good without him. You do have to be wary of three-point luck when you’re not specifically looking at a perimeter defender. His PAM (points above median) page is my first stop to see who's a Guy or a Dude, and also to quickly visualize who's doing what for a team's shooting efficiency:
Again, however, you need to contextualize this with usage data and assist data. For that you can go back to Kenpom, or try…
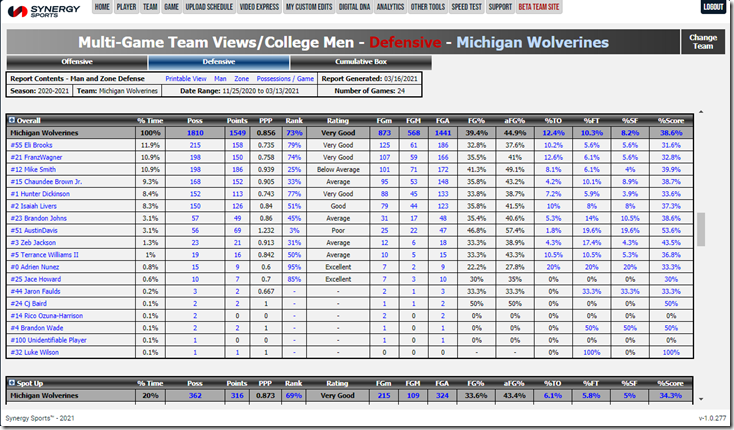
7. SYNERGY, the ultimate in paring down basketball stats into action, and the only reason I keep Microsoft’s browser on my computer, since that’s how we generate those shot charts. It also helps us spot good defenders, though you have to be really careful with how you read the defensive ratings…
…because it can’t really tell who was scored on, e.g. Chaundee Brown gets an “Average” because he spends more time on the court with Austin Davis and is always taking the opponent’s best guard. This site is great for finding upsets though because it can tell you how a team plays, and what they’re good at defending. For example I wouldn’t want to be a transition team that plays a lot of Iso ball against Michigan.
If all this is too in the weeds for you, there’s always the simpleton’s stat site…
7. SPORTS-REFERENCE.COM, whose Usage metric is almost the same as Pomeroy's (the biggest difference is they rate a free throw as 43.5% of a possession vs. Kenpom's 47.5%), and far more accessible for spreadsheeting purposes. Best known for baseball-reference, these statistical aggregators used the same scripts to build a database for college basketball and all the other major sports.
Because it's so automated there are mistakes that pop up, so don't use them for deep historical aggregates (e.g. Tom Izzo's career wins). Also their attempts at building their own statistics are almost always disasters—these are coders, not mathematicians, and their general understanding of the data they collect is about on par with that of your average basketball announcer (likewise their understanding of their own level of understanding). Exception: I like how they visualize a season that you can mouseover for context.
But you don't care about that, because their usefulness for raw stats is up there with having your average basketball announcer on speed dial, i.e. unparalleled. Try to focus more on your vast appreciation for what they provide, and less on how funny it is that in 2021 you still have to scroll past per-game to get to the raw and tempo-free numbers.
8. ESPN's BASKETBALL STAFF. Somehow John Gasaway and Joe Lunardi (and TomVH) managed to survive The Worldwide Leader's slimdown to a bare handful of loud, vastly overpaid morons and SEC slappies. Gasaway is the Dude in college basketball—all the context you're trying to parse out of stats and waterfall graphs above is already embedded in his brain, along with years of basketball watching to put that in context.
Just make sure you've got some strong anti-autoplay apps running on your browser. Or you could eschew the guys everybody reads for some familiar Twitter faces of…
9. BIG TEN GEEKS: A group of Big Ten fans who like to play with stats—@CT_In_TC is the Michigan fan there and also the keeper of the blog-beloved stat PORPAGATU, ie points over replacement per adjusted game at that usage. It's the closest thing to baseball's WAR in college basketball. Of course, if you've got $15 to spare and really want to geek out…
10. HOOP VISION'S SUBSTACK: This is Jordan Sperber and Rafi Goldman's scouting information on every team in the tournament and invaluable to our coverage. Jordan and Rafi were D-I video coordinators so this is exactly the kind of reports coaches get. In fact it's really made for the coaches. But you coach from the sideline, right?
March 16th, 2021 at 11:32 AM ^
Holy shit, I think I'm in over my head.
March 16th, 2021 at 11:52 AM ^
Thanks Seth. I have been waiting for this!!!!
March 16th, 2021 at 11:55 AM ^
Never apologize for using Excel
March 16th, 2021 at 12:03 PM ^
Damn Seth - not bad - but couldn’t you have tried something in FORTRAN or Pascal?
March 16th, 2021 at 12:44 PM ^
I have the Seth Tool open in Excel. I can select a first team, but I do not get the drop-down button to select a 2nd team to compare with the first team.
March 16th, 2021 at 12:59 PM ^
That's a work in progress. You can only see one team at the moment. I'll also be able to change the colors in 2.0.
March 16th, 2021 at 12:45 PM ^
Seth - Looks like somebody overwrote the Team 2 box and now the reference doesn't link to anything. Not sure how to fix it.
8.6.1I fixed it and removed the ability to edit the primary version. You can still make your own copy.
March 16th, 2021 at 12:52 PM ^
I'm sure Seth will fix it soon, but if you make a copy of the sheet you can fix it yourself.
Copy B3 to B4
Ctrl+F
Click the 3 dots to the right
Find: #REF!
Replace with: B4
Check box - also search within formula
Click - Replace all
I fixed it. I also locked the main version so you'll have to download your own now.
Well done! Thank you!
This is amazing...and wayyyyy too much. Because when Abilene Chistian somehow beats Texas and Gonzaga gets to the title game...why in the hell did I spend 22 hours delving into all of this!
This is amazing - thanks Seth!
March 17th, 2021 at 12:09 PM ^
How often is the data on the team comparison tool updated? thanks seth!
March 17th, 2021 at 12:33 PM ^
Seth this is absurd. You should probably sell this to people for like $5-$10 bucks each year, IMO. Thank you for doing this.
March 17th, 2021 at 12:51 PM ^
Thanks so much for pulling the spreadsheet together. It’s very helpful when looking at teams I’m unfamiliar with.
Thanks Seth as always! Gonna be up all night playing around with these.
Thanks, Seth!! I was hoping to see this.



Comments