visualizing data


For those tracking Denard's passing acumen the tale has been one of major progression before 2010, followed by regression in 2011 followed by re-progression as he a.) grew more comfortable in Borges's offense, b.) played more out of the shotgun, and c.) gave his staph infection time to heal.
If you were reading the weekly previews this season you would have noticed the space for Michigan's passing game was consistently fretting about Robinson's accuracy. This would be followed by a game with some flash of the laser precision he seemed to possess at times in 2010, followed by a bomb that overshot Hemingway/Roundtree by 20 yards. This was our concern. The more intelligent announcers talked about where his shoulders and toes were at their release, and Borges pressers reiterated the footwork theory.
Then sometime around Purdue-Iowa-Illinois, said all, 2010 Denard worked his way back. I'd like to use this space to test if that was really the case.
The Hennechart you know (screens and Snackycakes have been removed):
| Year | Opponent | DO | CA | MA | IN | BR | TA | BA | PR | SCR | DSR |
|---|---|---|---|---|---|---|---|---|---|---|---|
| 2009 | 2009, All Of It | 1 | 7 | 4 | 2 | 4 | 4 | - | - | ? | 44% |
| 2010 | Connecticut | 2 | 9 | - | - | 3 | 2 | - | - | 2 | 69% |
| Notre Dame | 3 | 17 | 2 | 4 | 1 | - | 3 | 2 | - | 71% | |
| Michigan State | 4 | 11 | 1 | 6 | 1 | - | - | 2 | 2 | 68% | |
| Iowa | 1 | 8 | 2 | 2 | 2 | - | 1 | - | - | 64% | |
| Penn State | 3 | 9 | 1 | 4 | 2 | - | 1 | - | - | 63% | |
| Illinois | 4 | 8 | 1 | 4 | 1 | 3 | - | - | - | 60% | |
| Purdue | 2 | 11 | 1 | 3 | 1 | 1 | 1 | 3 | - | 68% | |
| Wisconsin | 3 | 12 | 1 | 2 | 2 | 2 | - | - | - | 71% | |
| 2011 | W. Michigan | - | 5 | 4 | 3 | 1 | - | - | - | 1 | 56% |
| Notre Dame | 6 | 6 | 1 | 5 | 5 | 1 | 1 | 1 | - | 50% | |
| SD State | - | 8 | - | 4 | 2 | 1 | - | 1 | - | 53% | |
| Minnesota | 1 | 10 | 1 | 3 | 1 | - | - | - | - | 73% | |
| Northwestern | 4 | 9 | 1 | 7 | 2 | - | - | - | 1 | 59% | |
| Michigan State | 1 | 7 | 3 | 6 | 5 | - | 1 | 7 | 1 | 40% | |
| Purdue | 1 | 6 | - | 1 | 2 | 1 | - | 2 | - | 64% | |
| Iowa | 2 | 21 | 2 | 7 | 1 | - | 2 | 2 | - | 70% | |
| Illinois | 1 | 3 | 1 | 2 | - | - | - | 1 | 1 | 67% | |
| Nebraska | 1 | 9 | - | 2 | 2 | 1 | - | 1 | 3 | 67% | |
| Ohio State | 3 | 7 | 2 | 1 | - | 2 | - | - | 1 | 77% |
That's lots of numbers. The easy metric to break these down metric is Brian's Downfield Success Rating at the far right. That's Dead-Ons and Catchables divided by all the rest (marginals are excised). But a few years ago, while trying to get a handle on what we had in Forcier, a few users thought to visualize this. I try that now with Denard's career:

I centered in the middle of the marginals to show how good the very goods were and how bad the very bads got. You kind of have to look hard to see it, but there is a regression apparent. Denard seemed to level off in the Big Ten season last year to a good chunk of accurate balls, one or two bad reads, and as many inaccurate as were dead on. For a good part of this year it was that one temptress of a perfectly thrown ball, one to five bad reads, and almost as many balls to Tacopants as the vicinity of his receivers. By Ohio State, on pure downfield success rating, it was just outside the UFR-era hall of fame (on many fewer attempts):
| Season | QB | Opp. | W/L | DO | CA | MA | IN | BR | TA | BA | PR | ATT | DSR |
|---|---|---|---|---|---|---|---|---|---|---|---|---|---|
| 2007 | HENNE | Purdue | W | 3 | 20 | N/A | 1 | 1 | 1 | 1 | 2 | 29 | 85.20% |
| 2007 | HENNE | EMU | W | 4 | 16 | N/A | 1 | 0 | 1 | 2 | 1 | 25 | 83.30% |
| 2005 | HENNE | Ohio St | L | 6 | 27 | N/A | 1 | 1 | 4 | 1 | N/A | 40 | 82.50% |
| 2008 | SHERIDAN | Minn | W | 2 | 20 | 4 | 3 | 2 | 1 | 0 | 0 | 32 | 78.60% |
| 2005 | HENNE | MSU | W | 4 | 25 | N/A | 1 | 3 | 3 | 1 | N/A | 37 | 78.40% |
| 2011 | ROBINSON | Ohio St | W | 3 | 7 | 2 | 1 | 0 | 2 | 0 | 0 | 15 | 76.92% |
FTR by this metric, the Michigan State game this year is 3rd all time in the hall of shame, better only than Sheridan in the Badge of Fandom Endurance game vs. Northwestern, and Threet versus Purdue. Sheridan being on both lists was one (happy) fluke between games his coaches hardly let him throw more than a screen for fear of triggering an early duck season. 2011 Denard's is the opposite: one bad game amidst a bunch that range between mediocre and okay. His games aren't in the Junior Henne/Early Forcier range; they are about on par with Big Ten Forcier as a freshman, and he's better than freshman Mallett. This is without the legs.
There was also wide variance in number of throws, partly due to game-planning, but also having a lot to do with Borges leaning somewhat more on the running game when Michigan led. Look at the paucity of passes for Michigan against Purdue and Illinois, versus huge stacks for MSU (look at their pressure metric!) and Iowa. The percentages chart below can adjust for that a bit:

Click it to embiggen. I took out a few more bad defenses to make that one if you're wondering why fewer bars. Also those marks are the rankings by FEI of that opponent's pass defense—the worst pass defense would be at the very bottom, the best at the very top. Take with a huge grain of salt since FEI's weird this year. (No way Iowa and Purdue have the same secondary, nor do I believe either are 40 spots worse than Minnesota). Anyway it shows the metric is at least defense-independent.
This one has the story we've been telling: 2010 was fairly static, while 2011 was a dropoff followed by progression in the new offense (and a stinker in a trash tornado in the middle). Denard also maybe scrambled a bit more at the end of the season (the white bars). Overall you'd almost expect the two years to be flipped, with the hard learning and scrambling a sophomore campaign and the leveling off near the peak of the previous year the work of an upperclassman. If you consider time in the system, it's more like the work of a redshirt freshman followed by a true freshman.
The reads are another thing that fixed over time (Nebraska's weekly BR looks bigger in a small sample). The % of bad  reads this year all told took a rather scary dip from pushing Sr. Henne to Threet-ish:
| Player | BR/Att | DSR |
|---|---|---|
| HENNE 2007 | 6.12% | 71% |
| ROBINSON 2010 | 6.67% | 69% |
| FORCIER 2009 | 7.73% | 70% |
| THREET | 9.09% | 55% |
| ROBINSON 2011 | 9.17% | 61% |
| SHERIDAN | 10.00% | 60% |
| MALLETT | 10.69% | 51% |
| ROBINSON 2009 | 14.29% | 44% |
I'm ready to believe this was related to the footwork thing. If the staph infection affected him, it couldn't be more than the beating he took last year blamed for the perceived reduction in Big Ten play. There is evidence of greater pressure—the 7 categorized "PR" in the MSU game is one fewer than Brian gave for all of 2010—and all that.
How much this regression "hurt" Michigan this season can be overstated. Using all plays charted in UFR, Denard averaged 6.93 yards per play, as opposed to the 7.25 yards per play in 2010. That's not about bad defenses; against real opponents Denard's 6.55 YPA is better than his 6.30 in 2010. This is a result of the long passes against Notre Dame (10.09 YPP – which is ridiculous), but if we normalize every play longer than that to a cap of 20 yards, this is what he looks like per passing attempt (2010 schedule futzed with to match comparable games):
| 2010 | 2011 | ||
|---|---|---|---|
| Connecticut | 7.48 | WMU | 6.57 |
| Notre Dame | 6.00 | Notre Dame | 7.77 |
| Bowling Green | 10.75 | EMU | 6.55 |
| Penn State | 6.29 | SD State | 5.88 |
| Massachusetts | 7.56 | Minnesota | 8.84 |
| Indiana | 9.00 | Northwestern | 10.96 |
| Michigan State | 6.10 | Michigan State | 3.17 |
| Purdue | 5.91 | Purdue | 7.14 |
| Iowa | 5.79 | Iowa | 4.31 |
| Illinois | 7.95 | Illinois | 6.64 |
| Wisconsin | 6.75 | Nebraska | 6.73 |
| Ohio State | ??? | Ohio State | 7.35 |
Including only non-theoretical defenses (No FCS, EMU, BG, Indiana, WMU, NW), and again, counting everything over 20 yards as 20, Denard was getting 6.47 yards per attempt last year, and got 5.96 per passing attempt this year. That's still good. And it's a good bet, with a second year fusing with Mr. Borges, the performance level he got back to from Iowa through Nebraska is conceivable for the bowl game and beyond. If he can somehow sustain what he did against Ohio State he would be inconceivable.
It's been a while since this feature has made an appearance, but with a recent boom in good diaries, it's time to dust off the cobwebs and bring you the best in user-generated content. Write a good diary and you, too, can have your time in the spotlight!
A lot of diaries of late have been Lacrosse (me), Baseball (formerlyanonymous), or Recruiting (Tom/me) -related, but there's been some good user-generated content, as well. Though we haven't seen this feature since December, I'll restrict entries to the end of basketball season. I'm leaving 16-team Big Ten proposals alone for now, as Brian will probably bring them up later.
The Mathlete brought it strong over the past few weeks, including a look at which NCAA football teams have been the most and least lucky over the past two years. How did he define luck?
To try and answer these questions, I took my team PPG values for the full 2009 season and then “re-played” the regular season schedule to see how the season would play out if the teams played at that consistent level and the fluky plays were eliminated. All first half plays and any in the second half with the game within 2 touchdowns were included. Interceptions are included, fumbles are not. Standard special teams plays are included, punt blocks, on-sides kicks etc. are not.
Unsurprisingly, Michigan hasn't been so lucky either of the past two years:
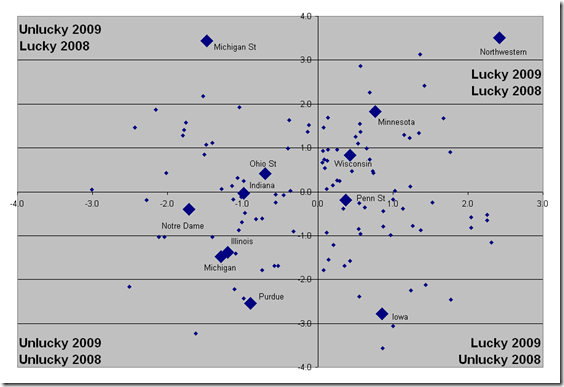
Northwestern has been the luckiest team in the nation two years running, so they may be in for a rude awakening sometime soon. MCalibur's lengthy diary presumably covers something similar (win expectations), but is more notable for how pretty its charts are.
Here offensive YPG is charted against defensive YPG. The horrible dot at the bottom is '08; the horrible dot to the right is '09. You can see how far from respectable Michigan was in '08 and the sizeable improvement last year, albeit not enough of one to expect a bowl game.
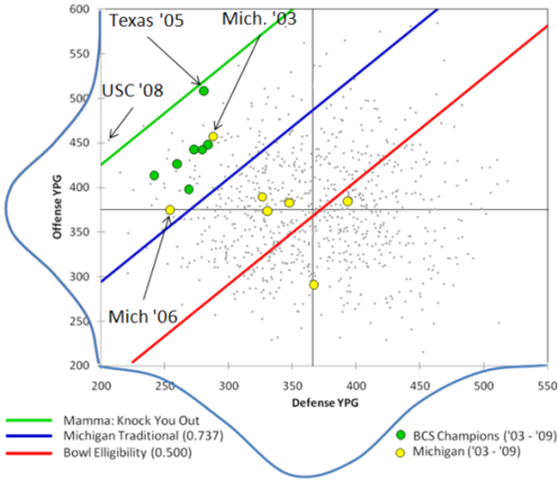
The Mathlete then delved into the importance of personnel, starting with the cumbersomely-titled post exploring the value of returning starters to a football team's success. Surprisingly, as long as your team wasn't among the bottom 20% in the country of returning starts at some key positions, returning experience isn't that big of a deal:
Returning starts don't matter as much as people think. The way they are most likely to affect a team is if you have very few. A whole host of returners isn't necessarily more valuable than a solid group. Just don't be stuck at the bottom, even a low ranking in a single position group can be worth a game or two.
So Michigan is losing its best three defenders, which bodes ill for the 2010 season, right? Not So Fast My Friend, as The Mathlete continued to outdo himself, crunching the numbers to reveal who were Michigan's top defensive players last year. Ryan Van Bergen comes in at a surprising #3, with Brandon Graham, in a shocker, the runaway leader with an adjusted score of 27.4. Donovan Warren's 8.7 was second.
The only positive performers who are returning are Van Bergen, Jonas Mouton, Mike Martin, and Obi Ezeh. Jordan Kovacs, Craig Roh, and Mike Leach were only slightly in the negative, all right around average nationally for their positions. The conclusion:
The most glaring point for me is that Michigan’s top linebacker, Mouton, barely makes the top 150 linebackers nationally in production. If Michigan’s defense is going to turn things around there is going to have be some new playmakers step up and there has to be more production from the linebackers.
Another shocker.
The Mathlete, for your research-laden diaries (and the charts, OH, the charts!), you are The Diarist of the... er... Spring!
Inspired by the recent changes to NFL overtime rules, ecormany proposes a few tweaks to the NCAA's overtime system. Among his ideas: reincorporate the punting game and give teams only two minutes to complete each possession in an overtime period.
In Can The Heat Be Beat?, Elno Lewis looks at the ever-growing dominance of so-called "warm weather teams" in winning football national titles. The results are striking:
Warm Weather Teams Winning Championships
1940 1950 1960 1970 1980 1990 2000 40.6% 47.5% 53.1% 53.8% 62.1% 68.4% 70.0%
It looks like the trend is still upward for warm-weather teams. Can northern squads like Michigan try to buck the trend? Follow-up question: can an infusion of Florida talent negate the trend? I'd be interested to see someone expand on Elno's research.
wildbackdunesman compares the respective CCHA coaching careers of Ron Mason and Red Berenson, and proposes a name-change of the CCHA Tournament trophy to the Mason-Berenson Cup. Red is comparable to Mason in every category of measuring success, and there's certainly a compelling argument to be made. It seems the only serious advantage Mason has is being the coach of more CCHA teams (Lake State, Bowling Green, and Michigan State, as compared to only Michigan for Red) and coaching longer than Berenson has so far.
With the NFL Draft coming up, Mat takes a look at whether Donovan Warren made the right choice in leaving Michigan a year early for the Big Leagues. The criteria to consider:
The potential gains for returning for one more year are:
- Another year of college life / experience
- Diploma
- Potential improved draft stock
...and the verdict:
Warren didn't make a mistake. Most guys who are drafted are not making a mistake when they turn pro. The decision is the correct one when all the costs and benefits are factored in for most. The decision is only a mistake is if you’re immediately cut and never earn a penny as a pro football player or are really enjoying life as a collegiate athlete and will miss it more than you’ll appreciate the money you’ll earn as a pro.
The reasoning behind this conclusion seems pretty sound, yet it inspired tons of debate in the comments. Both supporters and detractors of the premise raised a bunch of interesting points about Warren's draft stock, and how it affects their view of his decision.
mfan_in_ohio declares the Michigan fanbase's independence from Angry Michigan BLANK Hating God. The preamble proceeds thusly:
When in the course of sporting events it becomes necessary for fans to dissolve the bands which have connected them with another, a decent respect to the opinions of mankind requires that they should declare the causes which impel them to the separation.
...but the money quotes come in the airing of grievances.
Misopogon determines whether the three new NCAA football rules have an effect on Michigan. The verdicts? Wedge blocking ban: Help. Taunting rule: Hurt. Eyeblack message ban: Neutral. Click through to find out his reasoning.
Bust out the cigarettes and Fedoras, as BlueSeoul gives us a glimpse into the noir-style meeting between Jim Delaney and Notre Dame AD Jack Swarbrick's about the Irish joining the Big Ten. Plus he has to apologize at the end for getting to Star Wars-y.
An actual historical diary from Alaska Hokie shares the story of former Michigan quarterback James Miller.
WALLA WALLA, March 19.—James Miller, the famous quarterback of the Michigan team last year, who has been missing from his home for several months, was located in this city yesterday working as a laborer. His mind is a total blank and he is quite unable to recognize his friends. He was elected to the captaincy of the Wolverine team for next season.
Sounds like something out of the twilight zone (or at least the front page of MVictors). There's debate over whether his amnesia was a medical issue or a clever ruse to cover up for some personal issues.
stubob takes a stab at UFRing November's Ohio State football game (offense, defense). Chart? Chart.
Defense + - Graham 6 0 RVB 1 0 Herron 0 1 Heniger 0 1 Kovacs 2 2 Roh 1 2 Brown 1 2 Warren 3 0 Martin 1 0 Mouton 4 2 Leach 2 1 total 21 11
Denard Robinson was 1/1 with the pass being deemed "catchable," but Tate Forcier had a slightly rougher day.
On the basketball side of things, Champswest tries to figure out where Michigan's scoring will come from next year. Uh, Stu Douglass and Evan Smotrycz, apparently. I guess more balanced scoring is a good thing?
Etc.: Nantucket Blue, seemingly apropos of nothing, rips on Michigan State in Our Colors Don't Mix. In other Michigan State-related diaries, MGoData looks at the Google habits of East Lansing residents (seriously). Kman23 brainstorms ways to get Michigan's best receivers on the field at the same time. Jeff gives props to the streaking Women's Tennis team. Laveraneus looks at combined win/loss records for football and basketball across various schools and conference. MGlobules tries to round up some UConn spring game recaps. backusduo pre-previews EA's NCAA Football 2011.
Editors note: bumped from the diaries for research, interesting-ness, and cool graphs. Republished to get the images the right size. Original here for those who'd like to see the comments on it.
Some days ago, I made a first attempt at visualizing some of Brian's famous Hennecharts. After some feedback (thanks all) and some links to old data (thanks Misopogon), I now try again. Here are "Hennegraphs" for Tate so far this year, Threet from '08, and Henne from '07.
Tate so far this year: 
[Note: the hashed areas are passes I separated out as screens, which is new this year.]
Threet '08: 
and Henne '07:

And finally, Henne in the near-championship year '06:

Some explanations: I took Brian's suggestion to center at 0, pushing "good" events to the left, and "bad" events to the right. Slight adjustment: I moved "Marginal" all the way to the left (it is neither good or bad, but made slightly more sense on the left instead of centered in the middle, as we will see in below).
Recall also that bars that are not fully colored in represent screen passes (which Brian has started accounting for lately).
Also on the Hennegraph: Brian's metric of effectiveness, the Downfield Success Rating (DSR). The Tate '09 graph shows how this is calculated: DSR is the number of (Dead On + Catchable) throws divided by everything else except for Marginal and Pressure. Thus, it is the left blue part (ignoring marginal all the way on the left) divided by the blue part + right red/orange/yellow (ignoring pressure all the way on the right).
I also present the DSR percentage on the right of each bar, as well as the total number of attempts, and graphically depict the DSR number on the left in a dotted red line.
Putting all of this together made me realize the simple genius of what Brian is doing here. Instead of judging a QB by a simple number such as "percentage of passes completed" or some odd QB rating, he is simply analyzing each throw and qualitatively judging them in isolation of whether they were caught or not. Thus, DSR is an excellent replacement for "Completion Percentage" if you are just interested in measuring how well a QB is throwing the ball.
Hope you enjoy. As always, comments are welcome, and thanks to Brian (and Misopogon!) for the grading and the data; any errors, of course, in the Hennegraphs above are mine.
[Notes from me: You can see just on the charts how far the passing game has come from the "good" half of last year, and how far from a healthy Chad Henne—ie, 2006—it still is. And how awful it was for Michigan to suffer Henne's loss in '07.]
16