mitch mcgary
I saved this mailbag question because it required some digging, though little did I realize just how much. The query is simple enough:
When is the last time that all 5 of Michigan's starters dunked in a single game? #mgomailbag
— Dan Luchi (@Looukey) May 5, 2021
Michigan had a couple athletic point guards in the John Beilein era and tallied many glorious, dunk-filled blowouts. This should be easy. I'll still go year-by-year just in case something comes up; my shortcut is to use Bart Torvik's play-by-play data to check the number of dunks by the starting point guard(s), then investigate further if necessary.
_14.png)
all for naught [Marc-Grégor Campredon]
2020-21: The starting point guard is Mike Smith, who records zero dunks.
2019-20: Zavier Simpson records his first career dunk in a loss to Wisconsin; the only other Wolverine to throw it down in that game is Franz Wagner. C'mon, guys.
2018-19: Simpson doesn't dunk.
2017-18: Ditto, same goes for Jaaron Simmons and a pre-"Thunder" Eli Brooks.
2016-17: Derrick Walton does many incredible things. Dunking is not one of them.
2015-16: The mortal version of Walton also doesn't dunk.
2014-15: A cursed year in which a dunkless Walton gets hurt and his replacements are Spike Albrecht and Andrew Dakich.
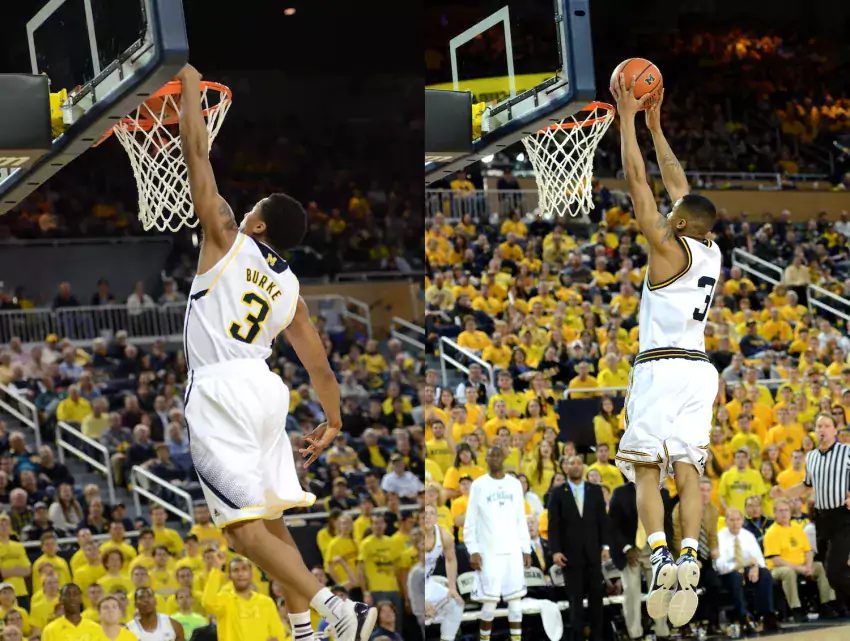
2013-14: A young, spry Walton attempts a slam at the Breslin Center. He misses it. Michigan wins, so it's cool, and he's also the only starter to even try to throw it down, so it doesn't really matter for this exercise. Anyway, that's the only dunk attempt of the year for him.
[Hit THE JUMP for the 2013 team getting remarkably close multiple times, but do they make it?]
MGoTheater 3000 Note: Michigan vs. Kansas, 2013 Sweet Sixteen, tonight, 8 pm ET, here on the front page and at twitch.tv/mgoace.
Today's basketball mailbag, as the title indicates, contains some indispensable information. I got enough questions to break this into two parts, so if you don't see yours here, there's a good chance it's running later this week.
Which team wins:
— Koernelius (@DJKoerndawg) March 24, 2020
Five Nik Stauskas's vs Five Mo Wagners
I hoped by sleeping on this question it'd be easier to answer. I was very wrong!
I assume we're going with the best version of each player while they were at Michigan. Wagner obviously has the edge in size while Stauskas gains an advantage in athleticism. Both can really shoot; Stauskas is the better outside marksman while Wagner has an array of post moves. The team of Stauskases (Stauskae?) will move the ball better and base an offense around isolations and a lethal pick-and-pop. The Wagners offense won't be as pretty, though it'll still feature some pick-and-pop.
It comes down to this: will the greater offensive skill and ball movement of the Stauskae overcome a rebounding advantage for the Wagners? In the end, I think the Niks are a half-step too quick.
Five Duncan Robinsons?
— Jonathan Moore (@jadamsmoore) March 24, 2020
Today's Duncan Robinson would make this really difficult—or perhaps not, he may just take it—as he's developed into one of the NBA's most dangerous shooters in Miami. While he was undoubtedly a great shooter at Michigan, he didn't possess the ability to hit shots on the move that he does now—he was a pure spot-up guy.
Since I'm, uh, sensing a theme, let's lean all the way into it. Top Ten White Guy Fives rankings since the start of the Beilein era:
- Nik Stauskas
- Mitch McGary
- Moe Wagner
- Iggy Brazdeikis
- Zack Novak
- Franz Wagner
- Duncan Robinson
- Stu Douglass
- Jon Teske
- Spike Albrecht
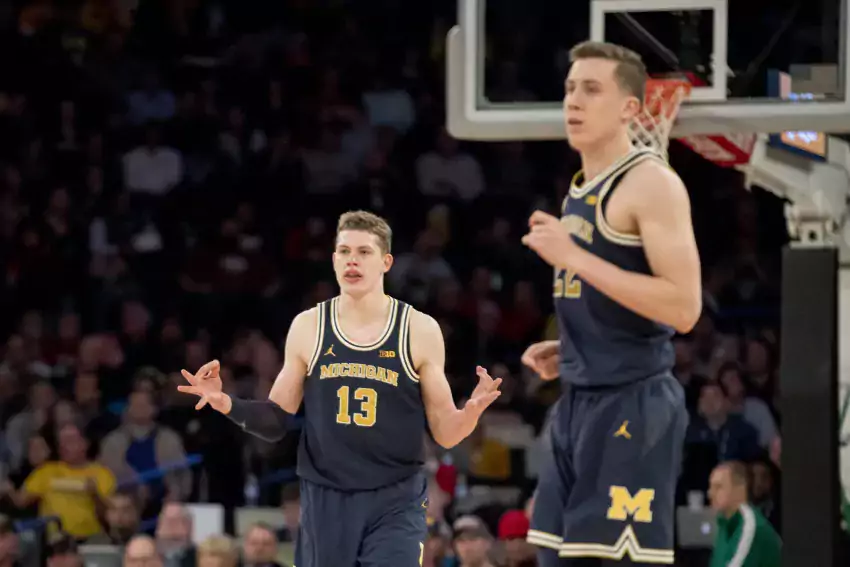
Being particularly large or small is a disadvantage here, with apologies to Teske and Spike. Mitch McGary may not have the outside shot of his counterparts, but his combination of offensive skill, defensive disruptiveness, and ability to bring a high level of energy put him above Wagner for me. If he played a little more in control, I'd have him above Stauskas, but the latter made too few mistakes.
Franz Wagner has the potential to move up very high on this list, which is an essential one indeed.
[Hit THE JUMP for more silliness, then some actual basketball analysis, then maybe a little more silliness.]
Previously: Part One
After looking at Michigan's stellar pick-and-roll production and how they do it last week, I dove deeper into Synergy's database to try to put this year's team in a historical context. At first I was just looking at other lead ballhandlers, then I was putting tables for every season together, then I realized I needed to add the screeners to the equation and look at how each team varied their P&R attack to do this right.
So what was going to be the second half of this series is now the second of either three or four parts. I'm trying not to make these too long to digest. These posts are going to be heavy on Synergy's stats, so I want to make a few notes before going any further.
While Synergy uses the terminology "points per possession" to describe how they measure production, that's very misleading when you're used to looking at KenPom. I'm switching over to describing Synergy stats as "points per play." The distinction is described in this useful Cleaning The Glass post:
CTG distinguishes between possessions and plays, and this distinction is important when diving into context information. A possession starts when a team gets the ball and ends when they lose it. A play ends when the team attempts a shot, goes to the foul line, or turns the ball over. If a team gets an offensive rebound, that results in a continuation of a possession but a new play. So a possession can have multiple plays.
Play contexts are per-play, not per-possession. For example, a team might come down in transition and miss a shot, get the offensive rebound, kick it out, and run a halfcourt set. Then might miss that shot but get a tip in to score and end the possession. That was all one possession, but three different plays and three different contexts: the first shot was in transition, the second in the halfcourt, and the third was a putback.
Because offensive rebounds start a new "play" within a possession, points per play are inherently going to be lower than points per possession. To help contextualize, I've included each player's national percentile rank for that season along with their stats.
For ballhandlers, "own offense" includes plays that finish with a field goal attempt, shooting foul, or turnover. "Passes" measure the result of shots that come as a direct result of the ballhandler's pass out of the pick-and-roll. "Keep percentage" is a stat I added myself that simply measures the percentage of a time the ballhandler uses his own offense instead of recording a passing play—Michigan has had players arrive at similar efficiency despite sporting very different styles.
an enjoyable pick-and-pop example
For screeners, you mostly just need to know the difference between popping, rolling, and slipping a screen:
- Popping: setting the screen and then stepping out (usually to the three-point line) for what's almost always a spot-up shot. Occasionally a more versatile big man will drive off a pop. Think Moe Wagner.
- Rolling: setting the screen and then going to the basket in the hopes of getting a layup/dunk. Think Jordan Morgan.
- Slipping: faking the screen before running to a predesignated spot—usually the rim, sometimes spotting up if it's a Wagner-type or perimeter player—as a changeup to keep defenses from overplaying the ballhandler.
As a general rule, points per play are going to higher when the screener finishes the play than the ballhander because of the nature of the pick-and-roll. A pass is usually going to be thrown to an open man when the play works; while the ballhandler could take a shot because he got open himself, he also usually has to finish the play if it's well defended.
Consider the degree of difficulty of Zavier Simpson's or Cassius Winston's shots; it's hard to be a really efficient scorer off the pick-and-roll. Morgan, while a great roll man, often just had to catch the ball and finish an uncontested shot at the rim. Most of Wagner's pick-and-pop threes went up without a real shot contest. This makes sense: there's little reason to pass the ball to your big man if he isn't open. Teams also often default to a quick screen in late clock situations, which tends to create more difficult shots the ballhandler has little choice but to take.
The other thing to note in the screener stats: under number of plays in each category, "%" shows the percentage of the time each player popped, rolled, or slipped out of their overall screener plays used. The "%ile" under points points play in each category, however, measures percentile national rank. I realize this is a little confusing but I couldn't come up with a better way than Synergy in this case.
With that out of the way, let's dive in.
[Hit THE JUMP for a year-by-year history of Michigan's pick-and-roll offense and what we can learn from it.]
41