A (Brief) Analysis of Michigan's Outside Shooting
So one of the consistent themes of this uneven season has been Michigan’s (and its opponents’), um, “variability” from shooting 3s. On a good day (like against Purdue) Michigan can run any team in the country out of the gym, while other times (like against Seton Hall or Minnesota) they can shoot themselves out of winnable games with just atrocious performances from outside. On the season Michigan’s 34% rate from 3 is just about the national average (170th out of 358 teams) and their opponents shot 33% from 3 (199th out of 358 teams, so again close to the middle). And yet, it rarely felt game-to-game like Michigan or its opponents produced “average” performances. Far too often one (and sometimes both) teams on the court either shot the lights out or were building nice two-family condos with the bricks that rained down.
But that’s just feelings, and far too often as a Michigan fan I find myself myopically following this travails of this team and assuming they’re either an outlier with no real reference point to base that on; the word “average” certainly wouldn’t have popped in my head when describing anything from downtown as it related to the Wolverines this year. So I set out to see if the vibes I was getting all year following this team were correct, that while Michigan may be “average” in the aggregate they got to that point through wild swings of the shoot pendulum. In other words, while the average of 0 and 100 is the same as the average of 49 and 51, the variability is quite a bit greater.
To this end, I’ve been scraping gamelog data from College Football Reference for some analytics during the season, so I figured with a couple of changes to my scripts I could do the same for its sister site College Basketball Reference. So I did that, pulling in the game logs for (virtually) every team in D1 this year. There were some gaps in the data, mostly for smaller teams that didn’t have per-game data for certain opponents, but I wound up capturing over 11k games played this season. Each game log provides a lot of the top-line stats that serve as the backbone for a ton of the advanced metrics we’ve come to rely on as sports consumers, including the Four Factors metrics that do a great job of predicting how teams match up.
But I wasn’t interested in effective FG rate or offensive rebound percentage for the Wolverines; I was interested in knowing if the dramatic swings in shooting I witnessed game-to-game was a real phenomenon or just confirmation bias with a sprinkling of statistical illiteracy on top. Now, someone with a stronger analytics background than myself could write tomes about offensive and defensive efficiency in college basketball, and there are a multitude of factors that can’t be captured by a box score fueling the performances we watch every gameday. But for the purposes of this exercise, I narrowed my focus on seeing if the 3-point shooting performances I saw exercised by and upon the Wolverines this year were as extreme as they felt.
So with that pretext out of the way, here’s what I looked at. I took every 3-point FG percentage by every team I was able to scrape and computed each team’s average both for and against them. Pretty simple stuff and information you can find on any team site. As noted above, Michigan slotted in pretty “average” on both accounts, and within the conference they were toward the bottom (9th out of 14, with lower being better) in terms of outside shooting against and toward the bottom (10th out of 14, lower being better) in terms of outside shooting for. In other words, Michigan was below-average in the Big 10 defending the 3 AND below average at hitting their own outside shots, a conclusion that I hope won’t come as a shock to anyone reading this. Here’s said results in chart form:
Team 3PT Shooting

Opponent 3PT Shooting

So like I said, no shockers here. But as I alluded to above, the journey these teams took to these averages is probably a bit more interesting that the destination. So I turned my eye of Standard Deviation, that mathematical concept that tries to capture the dispersion of values around said average. In shooting a low standard deviation points to a consistent performance game-to-game from outside, while a large value points to more variability by the team shooting and/or defending the 3 every night. So I computed the standard deviation for each game performance I recorded in my sample and wound up with the following for Michigan:
- Opponent 3 PT shooting standard deviation: 12.82% (!)
- 3 PT shooting standard deviation: 15.59% (!!)
Written out another way, in 2/3 of Michigan’s games they shot between 18% and 49% and gave up 3s at a rate between 21% and 47%. That’s…a pretty big-ass range, in particular offensively. Nationally, Michigan 3PT defense’s standard deviation was 23rd nationally (lower being worse), behind a bunch of bad P6-ish teams (Louisville and St. Josephs were worse) and a bunch of smaller programs like Marist, Harvard (poor Amaker), and Portland State. Offensively, the Wolverines were #1 nationally (lower being worse) in terms of their 3 PT shooting, which means Michigan was the most variable team in the country shooting the three by this metric. Virginia was right behind Michigan at 15.06% and then a whole lotta schools like Old Dominion, Utah Valley, and Cal State Northridge in the 13% range.
So yeah, if you thought at various times during the year “man, I have no idea how this team is going to do shooting and defending the outside shot this game”, you’re not wrong. And in conference, the difference is even more stark. Here’s some charts:
Team 3PT Shooting Std Dev

Opponent 3PT Shooting Std Dev

Michigan led the conference in both categories but while the defense was closer to the pack (half the league was within 2 percentage points of the Wolverines), offensively Michigan was nearly 3 percentage points worse than Rutgers, the next-closest in terms of variable outside shooting. And that’s a team with the nation’s 107th-ranked offense per KenPom and guys like Geo Baker launching 150 3s this year. For perspective, the gap between Michigan and the Scarlett Knights (2.68%) is the same gap between Indiana (who is #3 in the conference) and Ohio State (who is #9). It’s a chasm that Michigan probably couldn’t even fill with bricks on their worst shooting games.
As noted, this discrepancy shouldn’t come as a shock to Michigan fans, though the amplitude is more pronounced than I expected. Michigan lacks consistent outside shooters; even the “better” ones like Brooks and Houstan have been inconsistent and anecdotally it feels like the team as a whole struggles to generate open looks from outside except by scheme; they don’t have guys who can quickly fire off the dribble or generate space by themselves. And defensively the team has struggled for most the year against basically all forms of shooting, and especially against mobile wings and guards who can penetrate and kick the ball out to open, expectant shooters.
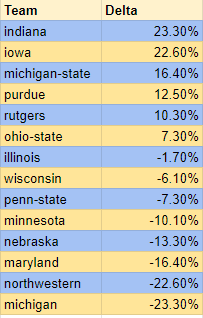
But at the same time, you wouldn’t be wrong to remember games where Michigan felt a bit snakebitten, when they couldn’t hit open looks while their opponents were having their prayers answered on strongly contested heaves. So for one final bit of analysis, I computed the delta between a team’s outside shooting and their opponent for every game and aggregated the total. If the team shot better than their opponent on that night the difference was positive; the opposite occurred and they had a negative delta.
This analysis produced some surprising results (Baylor was #2 by this metrics with a cumulative -38%, which means they played in a lot of games where the other team shot better from 3 than they did). Other notable teams are Florida at #11 and Arkansas at #17 while on the other end of the spectrum Oklahoma was #1 with +39% and potential Round 32 opponent Tennessee clocking in at +31%, good for 9th-best in the country. Michigan was –23% on the year by this metric, #35 in the country on the bad side and #1 in conference.
I know Northwestern just re-upped with Chris Collins and that’s likely not going to work out but they’ve absolutely been snakebitten a bit because offensively they shoot about 35% from 3 and gave up 36%, yet like Michigan struggled to get their numbers in sync. Indiana’s perimeter defense was solid all year and it tended to go in lock-step with their own shooting, so not a huge surprise on that end either. And Iowa, when they were on, just blew their opponents out of the water shooting the ball while defensively they tended to at least force teams to miss a couple.
All that said, there’s likely a fair bit of luck involved in these shooting numbers. Purdue shot the ball incredibly well on average (nearly 40% on the season) but were far more variable in their performances than you’d have expected, and seemed to clump their good games together more than their bad ones; when they were off they were REALLY off. I’m not sure if you can gameplan for that or how that’ll hold in a tournament setting.
Caveats and Conclusions:
The biggest caveat is that I could be doing this all wrong statistically. There are undoubtedly better models to have used here, and even relying on standard deviation introduces assumptions in terms of distributions that may not be correct. Furthermore, I recognize that I didn’t weigh the shooting percentages with the number of attempts taken; hitting 50% of 8 shots is different than 50% of 16 shots in terms of impact on the game and how that might have affected, say, the quality of the shots taken by your opponent. So if you’re interested in analyzing this data yourself or have suggestions for other things I could look at, please share them in the comments below.
But all that said, this analysis confirmed what I thought watching this team – they’re incredibly inconsistent on both ends of the court when it comes to outside shooting, and a number of their games have turned on what value was spit out by the basketball random number generator. If UM gets hot from outside they can beat almost anyone in the country; they’re just as likely to shoot themselves out of the tournament or let their opponents reenact Rock and Jock highlights. But it does speak to Michigan’s resiliency that they were able to make the tournament despite this extreme inconsistency, and you don’t have to squint that hard to see how they could rectify it next season with a bit more consistency and some improved luck.
If you’re wondering – Colorado State was basically average in this analysis, with a standard deviation of 10.7% on 36% shooting, 10.4% on 32% shooting on defense, and a delta of 10% overall. No opponent adjustments involved so take these numbers with a grain of salt, but they’ll likely shoot a bit better than they give up but aren’t particularly combustible on either end of the court.
Anyway, excited that Michigan will be playing on Thursday against a reasonably competitive opponent. And who knows – maybe they’ll piece together a couple of atypical games and find themselves in the Sweet 16. They certainly have it in them.
March 15th, 2022 at 11:42 PM ^
Damn