
2022 FBS Tempo Data

This is just a data dump.
To include tempo information in my HTTV previews I needed to reproduce good adjusted tempo data from last year's play-by-play information. This meant a TON of cleanup on the drive data the schools report to the NCAA (and which gets republished by, e.g. ESPN, in the box scores). Special thank you to Fox Sports for producing some of their own drive data to check against, and several schools that went back and repaired mistakes. No thanks to teams like Virginia Tech and various barely-FBS Sun Belters who routinely screw up their data and cause people like me all kinds of extra work.
I've removed Garbage Drives, using Fremeau's definition, plus two-minute drill situations were excised. Punts are also removed, mostly (by the schools themselves). Hopefully the college football world finds this useful. Unsurprisingly you won't have to scroll far up from the bottom to find Michigan. I've also bolded Michigan and their 2023 opponents.
Big table of data after THE JUMP.
| Team | Conf | Seconds | Plays | Plays/Min | Nat Rk | Percentile |
|---|---|---|---|---|---|---|
| Indiana | Big Ten | 14560 | 857 | 3.532 | 1 | 100% |
| Oklahoma | Big 12 | 15726 | 909 | 3.468 | 2 | 96% |
| Oklahoma State | Big 12 | 17609 | 989 | 3.370 | 3 | 89% |
| Tennessee | SEC | 14944 | 836 | 3.357 | 4 | 88% |
| Ole Miss | SEC | 16565 | 911 | 3.300 | 5 | 84% |
| Kent State | MAC | 13728 | 749 | 3.274 | 6 | 82% |
| Ball State | MAC | 14827 | 787 | 3.185 | 7 | 76% |
| Middle Tennessee | ConfUSA | 15974 | 838 | 3.148 | 8 | 73% |
| Texas Tech | Big 12 | 19956 | 1043 | 3.136 | 9 | 72% |
| Georgia Southern | Sun Belt | 16730 | 873 | 3.131 | 10 | 72% |
| SMU | AAC | 18196 | 948 | 3.126 | 11 | 72% |
| Wake Forest | ACC | 17908 | 918 | 3.076 | 12 | 68% |
| Florida International | ConfUSA | 13780 | 702 | 3.057 | 13 | 67% |
| Utah State | MtnWest | 16764 | 854 | 3.057 | 14 | 67% |
| Florida Atlantic | ConfUSA | 13103 | 660 | 3.022 | 15 | 64% |
| Nevada | MtnWest | 15219 | 765 | 3.016 | 16 | 64% |
| Georgia State | Sun Belt | 15761 | 785 | 2.988 | 17 | 62% |
| Northwestern | Big Ten | 16723 | 832 | 2.985 | 18 | 62% |
| Texas | Big 12 | 15287 | 754 | 2.959 | 19 | 60% |
| Arkansas | SEC | 18957 | 934 | 2.956 | 20 | 60% |
| North Texas | ConfUSA | 15828 | 779 | 2.953 | 21 | 60% |
| Western Kentucky | ConfUSA | 17910 | 876 | 2.935 | 22 | 58% |
| Nebraska | Big Ten | 15611 | 762 | 2.929 | 23 | 58% |
| Toledo | MAC | 18986 | 926 | 2.926 | 24 | 58% |
| Old Dominion | ConfUSA | 14252 | 695 | 2.926 | 25 | 58% |
| Hawaii | MtnWest | 15284 | 739 | 2.901 | 26 | 56% |
| Virginia | ACC | 13557 | 653 | 2.890 | 27 | 55% |
| Temple | AAC | 14245 | 682 | 2.873 | 28 | 54% |
| Arkansas State | Sun Belt | 15681 | 746 | 2.854 | 29 | 53% |
| UTSA | ConfUSA | 19254 | 912 | 2.842 | 30 | 52% |
| Washington State | Pac-12 | 16352 | 774 | 2.840 | 31 | 52% |
| Marshall | ConfUSA | 16228 | 762 | 2.817 | 32 | 50% |
| Tulsa | AAC | 17553 | 824 | 2.817 | 33 | 50% |
| UCLA | Pac-12 | 18137 | 849 | 2.809 | 34 | 49% |
| Boston College | ACC | 14539 | 676 | 2.790 | 35 | 48% |
| Central Michigan | MAC | 15387 | 715 | 2.788 | 36 | 48% |
| Akron | MAC | 12187 | 565 | 2.782 | 37 | 48% |
| Texas State | Sun Belt | 16463 | 761 | 2.773 | 38 | 47% |
| Cincinnati | AAC | 17089 | 789 | 2.770 | 39 | 47% |
| Virginia Tech | ACC | 15352 | 708 | 2.767 | 40 | 47% |
| UCF | AAC | 19450 | 892 | 2.752 | 41 | 45% |
| North Carolina | ACC | 21422 | 982 | 2.750 | 42 | 45% |
| UL-Lafayette | Sun Belt | 18828 | 862 | 2.747 | 43 | 45% |
| Stanford | Pac-12 | 15498 | 705 | 2.729 | 44 | 44% |
| Georgia Tech | ACC | 17078 | 773 | 2.716 | 45 | 43% |
| Maryland | Big Ten | 18526 | 837 | 2.711 | 46 | 43% |
| Louisville | ACC | 18008 | 811 | 2.702 | 47 | 42% |
| Texas A&M | SEC | 17380 | 780 | 2.693 | 48 | 41% |
| Illinois | Big Ten | 20941 | 939 | 2.690 | 49 | 41% |
| California | Pac-12 | 16953 | 759 | 2.686 | 50 | 41% |
| UNLV | MtnWest | 13106 | 586 | 2.683 | 51 | 41% |
| Liberty | Ind (G5) | 19283 | 862 | 2.682 | 52 | 41% |
| Memphis | AAC | 19066 | 851 | 2.678 | 53 | 40% |
| Bowling Green | MAC | 16804 | 749 | 2.674 | 54 | 40% |
| Penn State | Big Ten | 16756 | 745 | 2.668 | 55 | 40% |
| Alabama | SEC | 17574 | 781 | 2.666 | 56 | 39% |
| Mississippi State | SEC | 18970 | 843 | 2.666 | 57 | 39% |
| Rutgers | Big Ten | 14762 | 655 | 2.662 | 58 | 39% |
| San Jose State | MtnWest | 17160 | 761 | 2.661 | 59 | 39% |
| Colorado | Pac-12 | 11695 | 518 | 2.658 | 60 | 39% |
| WMU | MAC | 18494 | 818 | 2.654 | 61 | 39% |
| Clemson | ACC | 21902 | 968 | 2.652 | 62 | 38% |
| Buffalo | MAC | 18778 | 829 | 2.649 | 63 | 38% |
| Southern Miss | ConfUSA | 18192 | 803 | 2.648 | 64 | 38% |
| Iowa | Big Ten | 18035 | 795 | 2.645 | 65 | 38% |
| West Virginia | Big 12 | 18052 | 793 | 2.636 | 66 | 37% |
| Iowa State | Big 12 | 19278 | 845 | 2.630 | 67 | 37% |
| Miami-OH | MAC | 15003 | 656 | 2.623 | 68 | 36% |
| James Madison | Sun Belt | 16897 | 738 | 2.621 | 69 | 36% |
| NC State | ACC | 20379 | 890 | 2.620 | 70 | 36% |
| Purdue | Big Ten | 20210 | 882 | 2.619 | 71 | 36% |
| Tulane | AAC | 19239 | 839 | 2.617 | 72 | 36% |
| Arizona | Pac-12 | 16728 | 729 | 2.615 | 73 | 36% |
| Ohio State | Big Ten | 17966 | 782 | 2.612 | 74 | 36% |
| South Alabama | Sun Belt | 20576 | 895 | 2.610 | 75 | 36% |
| Oregon | Pac-12 | 19205 | 835 | 2.609 | 76 | 35% |
| Michigan State | Big Ten | 15930 | 692 | 2.606 | 77 | 35% |
| TCU | Big 12 | 23430 | 1015 | 2.599 | 78 | 35% |
| Washington | Pac-12 | 20660 | 893 | 2.593 | 79 | 34% |
| Boise State | MtnWest | 18567 | 794 | 2.566 | 80 | 32% |
| LSU | SEC | 20056 | 856 | 2.561 | 81 | 32% |
| Syracuse | ACC | 16406 | 700 | 2.560 | 82 | 32% |
| South Carolina | SEC | 18082 | 771 | 2.558 | 83 | 32% |
| Missouri | SEC | 18426 | 783 | 2.550 | 84 | 31% |
| Appalachian State | Sun Belt | 17919 | 761 | 2.548 | 85 | 31% |
| Kansas State | Big 12 | 21304 | 903 | 2.543 | 86 | 31% |
| Louisiana Tech | ConfUSA | 17808 | 751 | 2.530 | 87 | 30% |
| Fresno State | MtnWest | 20309 | 855 | 2.526 | 88 | 30% |
| NIU | MAC | 18244 | 765 | 2.516 | 89 | 29% |
| Miami | ACC | 18219 | 763 | 2.513 | 90 | 29% |
| Wisconsin | Big Ten | 16537 | 692 | 2.511 | 91 | 29% |
| New Mexico | MtnWest | 15503 | 648 | 2.508 | 92 | 28% |
| Houston | AAC | 19586 | 818 | 2.506 | 93 | 28% |
| Wyoming | MtnWest | 19231 | 803 | 2.505 | 94 | 28% |
| UL-Monroe | Sun Belt | 16688 | 696 | 2.502 | 95 | 28% |
| Florida | SEC | 19032 | 792 | 2.497 | 96 | 28% |
| Eastern Michigan | MAC | 17498 | 727 | 2.493 | 97 | 27% |
| Florida State | ACC | 18612 | 769 | 2.479 | 98 | 26% |
| Auburn | SEC | 18284 | 754 | 2.474 | 99 | 26% |
| South Florida | AAC | 15533 | 640 | 2.472 | 100 | 26% |
| BYU | Ind (G5) | 16701 | 685 | 2.461 | 101 | 25% |
| Arizona State | Pac-12 | 15580 | 638 | 2.457 | 102 | 25% |
| Ohio | MAC | 20896 | 848 | 2.435 | 103 | 23% |
| Charlotte | ConfUSA | 15207 | 616 | 2.430 | 104 | 23% |
| Troy | Sun Belt | 20978 | 849 | 2.428 | 105 | 23% |
| East Carolina | AAC | 18023 | 728 | 2.424 | 106 | 22% |
| Colorado State | MtnWest | 16869 | 681 | 2.422 | 107 | 22% |
| Vanderbilt | SEC | 17794 | 718 | 2.421 | 108 | 22% |
| UConn | AAC | 17335 | 695 | 2.406 | 109 | 21% |
| New Mexico State | Ind (G5) | 15299 | 613 | 2.404 | 110 | 21% |
| Pittsburgh | ACC | 23117 | 926 | 2.403 | 111 | 21% |
| San Diego State | MtnWest | 18766 | 751 | 2.401 | 112 | 21% |
| UTEP | ConfUSA | 19881 | 795 | 2.399 | 113 | 21% |
| Georgia | SEC | 23438 | 931 | 2.383 | 114 | 20% |
| Baylor | Big 12 | 21403 | 850 | 2.383 | 115 | 20% |
| Notre Dame | Ind (P5) | 21613 | 856 | 2.376 | 116 | 19% |
| USC | Pac-12 | 22898 | 906 | 2.374 | 117 | 19% |
| Michigan | Big Ten | 22501 | 884 | 2.357 | 118 | 18% |
| Massachusetts | Ind (G5) | 16706 | 655 | 2.352 | 119 | 18% |
| Kansas | Big 12 | 19570 | 765 | 2.345 | 120 | 17% |
| Duke | ACC | 20672 | 807 | 2.342 | 121 | 17% |
| Utah | Pac-12 | 21946 | 855 | 2.338 | 122 | 16% |
| Oregon State | Pac-12 | 20061 | 777 | 2.324 | 123 | 16% |
| Coastal Carolina | Sun Belt | 19642 | 752 | 2.297 | 124 | 14% |
| UAB | ConfUSA | 19176 | 727 | 2.275 | 125 | 12% |
| Rice | ConfUSA | 19984 | 735 | 2.207 | 126 | 7% |
| Navy | AAC | 17414 | 638 | 2.198 | 127 | 7% |
| Minnesota | Big Ten | 20683 | 756 | 2.193 | 128 | 6% |
| Army | Ind (G5) | 19446 | 704 | 2.172 | 129 | 5% |
| Kentucky | SEC | 21580 | 780 | 2.169 | 130 | 5% |
| Air Force | MtnWest | 20380 | 714 | 2.102 | 131 | 0% |
February 10th, 2023 at 1:23 PM ^
In case you guys saw there hasn't been much content this week and wondered "Where's Seth?" I've been deep in my spreadsheets.
February 10th, 2023 at 1:28 PM ^
"Unsurprisingly you won't have to scroll far to find Michigan" Did you put the table in sorted the wrong way? Currently Michigan is almost at the bottom with 100+ teams to scroll through get there.
February 10th, 2023 at 1:42 PM ^
i was surprised
February 10th, 2023 at 1:33 PM ^
A freak in the (spread) sheets...
February 10th, 2023 at 1:32 PM ^
App State runs more plays per minute than us. Too soon?
February 10th, 2023 at 1:32 PM ^
That is some slowwwwwwwwww tempo there. Cannot imagine the spreadsheet-wrestling that went into this one. Nice work!
February 10th, 2023 at 1:36 PM ^
I find it interesting that we’re nearly identical to Georgia.
February 10th, 2023 at 1:38 PM ^
I find it very interesting that there are no top teams in the bottom 50ish except for a very tight grouping of Michigan, USC, Georgia, and Notre Dame. Something about running between 2.357-2.383 plays per minute seems to correlate to success.
February 10th, 2023 at 1:50 PM ^
I was thinking the other way around. That success correlates to running only about 2.357-2.383 plays per minute. When you win almost every game, you are up and early and you start to milk the game.
February 10th, 2023 at 1:58 PM ^
From the eye test there doesn't appear to be much correlation between tempo and winning. But I don't know how to take that data and run it into Excel to draw conclusions with any confidence.
Seth, how hard would that be? Or do we have to wait for HTTV to find out?
February 10th, 2023 at 2:08 PM ^
Pretty quick. I can just cross-reference it with last year's SP+ ratings. Conclusion: R-squared of just 1.5%. Not correlated.

February 10th, 2023 at 2:54 PM ^
Just did the same thing with F+ and Win% before scrolling down to make sure no one else had already done it...

February 10th, 2023 at 3:01 PM ^
I am not saying slower tempo correlates to more wins, in fact, it seems like most teams with slower tempo are not good. I was just noting that small pocket of success amid the garbage and that very tiny range seems to have a correlation with winning while anything slower or better than that by 20-30 spots has low success
February 10th, 2023 at 1:58 PM ^
This is very interesting data. It does seem to tilt towards passing teams. If I'm understanding this correctly, it's plays per minute of game clock time. So if my team throws an incompletion, the clock stops and I can get more plays in per minute. I suppose running out of bounds and running for a first down also skews things a little. Still, overall, it matches up with the eye test.
February 10th, 2023 at 2:55 PM ^
The clock only stops on OOB plays to reset the ball so the pass/run thing doesn't matter as much anymore. I tried messing around with it, but it was going to have to get super granular.
I do have passing plays broken out.
There wasn't a huge relationship (r-squared was 7.3%) between percent of all plays that were incompletes and Tempo.
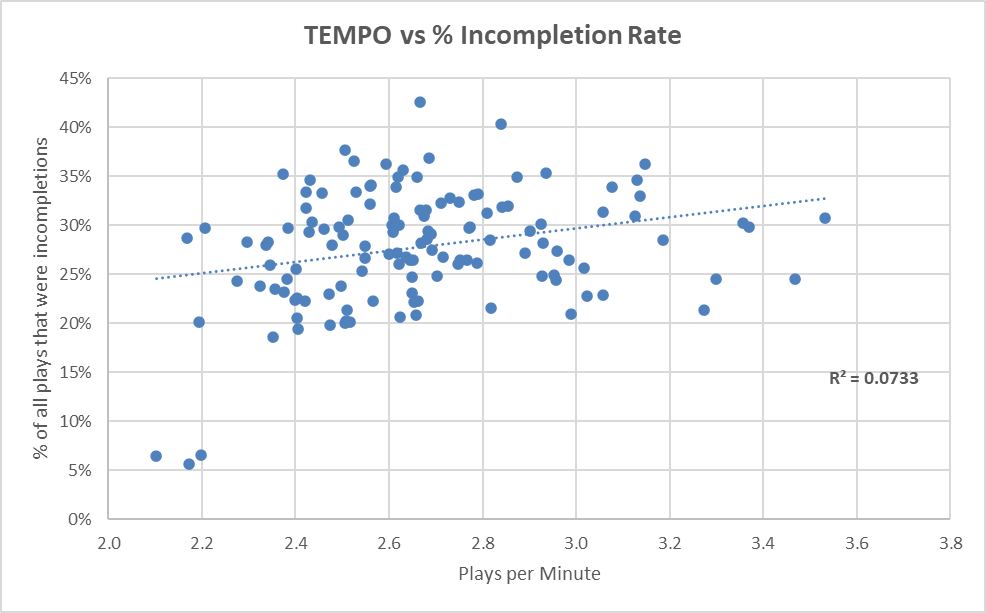
If I make a 7.33% adjustment it does change some rankings: Cal falls to 64th (from 50th), Miss State falls to 70th (from 57th). But it's not a huge change.
| Rk | Team | Conf | Seconds | Plays | Plays/Min | Nat Rk | Incomplete % | Adj Tempo | Rk | Change |
|---|---|---|---|---|---|---|---|---|---|---|
| 1 | Indiana | Big Ten | 14560 | 857 | 3.532 | 1 | 31% | 3.506 | 1 | 0 |
| 2 | Oklahoma | Big 12 | 15726 | 909 | 3.468 | 2 | 25% | 3.467 | 2 | 0 |
| 3 | Oklahoma State | Big 12 | 17609 | 989 | 3.370 | 3 | 30% | 3.347 | 3 | 0 |
| 4 | Tennessee | SEC | 14944 | 836 | 3.357 | 4 | 30% | 3.332 | 4 | 0 |
| 5 | Ole Miss | SEC | 16565 | 911 | 3.300 | 5 | 24% | 3.298 | 5 | 0 |
| 6 | Kent State | MAC | 13728 | 749 | 3.274 | 6 | 21% | 3.285 | 6 | 0 |
| 7 | Ball State | MAC | 14827 | 787 | 3.185 | 7 | 28% | 3.168 | 7 | 0 |
| 8 | Texas Tech | Big 12 | 19956 | 1043 | 3.136 | 9 | 33% | 3.101 | 8 | -1 |
| 9 | Middle Tennessee | ConfUSA | 15974 | 838 | 3.148 | 8 | 36% | 3.099 | 9 | 1 |
| 10 | SMU | AAC | 18196 | 948 | 3.126 | 11 | 31% | 3.099 | 10 | -1 |
| 11 | Georgia Southern | Sun Belt | 16730 | 873 | 3.131 | 10 | 35% | 3.089 | 11 | 1 |
| 12 | Utah State | MtnWest | 16764 | 854 | 3.057 | 14 | 23% | 3.062 | 12 | -2 |
| 13 | Wake Forest | ACC | 17908 | 918 | 3.076 | 12 | 34% | 3.037 | 13 | 1 |
| 14 | Florida International | ConfUSA | 13780 | 702 | 3.057 | 13 | 31% | 3.028 | 14 | 1 |
| 15 | Florida Atlantic | ConfUSA | 13103 | 660 | 3.022 | 15 | 23% | 3.028 | 15 | 0 |
| 16 | Nevada | MtnWest | 15219 | 765 | 3.016 | 16 | 26% | 3.010 | 16 | 0 |
| 17 | Georgia State | Sun Belt | 15761 | 785 | 2.988 | 17 | 21% | 3.001 | 17 | 0 |
| 18 | Northwestern | Big Ten | 16723 | 832 | 2.985 | 18 | 26% | 2.976 | 18 | 0 |
| 19 | Arkansas | SEC | 18957 | 934 | 2.956 | 20 | 24% | 2.955 | 19 | -1 |
| 20 | North Texas | ConfUSA | 15828 | 779 | 2.953 | 21 | 25% | 2.950 | 20 | -1 |
| 21 | Texas | Big 12 | 15287 | 754 | 2.959 | 19 | 27% | 2.947 | 21 | 2 |
| 22 | Toledo | MAC | 18986 | 926 | 2.926 | 24 | 25% | 2.924 | 22 | -2 |
| 23 | Nebraska | Big Ten | 15611 | 762 | 2.929 | 23 | 28% | 2.912 | 23 | 0 |
| 24 | Old Dominion | ConfUSA | 14252 | 695 | 2.926 | 25 | 30% | 2.902 | 24 | -1 |
| 25 | Western Kentucky | ConfUSA | 17910 | 876 | 2.935 | 22 | 35% | 2.890 | 25 | 3 |
| 26 | Hawaii | MtnWest | 15284 | 739 | 2.901 | 26 | 29% | 2.880 | 26 | 0 |
| 27 | Virginia | ACC | 13557 | 653 | 2.890 | 27 | 27% | 2.878 | 27 | 0 |
| 28 | Temple | AAC | 14245 | 682 | 2.873 | 28 | 35% | 2.830 | 28 | 0 |
| 29 | Marshall | ConfUSA | 16228 | 762 | 2.817 | 32 | 22% | 2.828 | 29 | -3 |
| 30 | Arkansas State | Sun Belt | 15681 | 746 | 2.854 | 29 | 32% | 2.824 | 30 | 1 |
| 31 | UTSA | ConfUSA | 19254 | 912 | 2.842 | 30 | 32% | 2.812 | 31 | 1 |
| 32 | Tulsa | AAC | 17553 | 824 | 2.817 | 33 | 29% | 2.799 | 32 | -1 |
| 33 | UCLA | Pac-12 | 18137 | 849 | 2.809 | 34 | 31% | 2.780 | 33 | -1 |
| 34 | Central Michigan | MAC | 15387 | 715 | 2.788 | 36 | 26% | 2.780 | 34 | -2 |
| 35 | Washington State | Pac-12 | 16352 | 774 | 2.840 | 31 | 40% | 2.776 | 35 | 4 |
| 36 | Virginia Tech | ACC | 15352 | 708 | 2.767 | 40 | 26% | 2.758 | 36 | -4 |
| 37 | Boston College | ACC | 14539 | 676 | 2.790 | 35 | 33% | 2.754 | 37 | 2 |
| 38 | Texas State | Sun Belt | 16463 | 761 | 2.773 | 38 | 30% | 2.751 | 38 | 0 |
| 39 | Cincinnati | AAC | 17089 | 789 | 2.770 | 39 | 30% | 2.748 | 39 | 0 |
| 40 | Akron | MAC | 12187 | 565 | 2.782 | 37 | 33% | 2.746 | 40 | 3 |
| 41 | UCF | AAC | 19450 | 892 | 2.752 | 41 | 26% | 2.742 | 41 | 0 |
| 42 | UL-Lafayette | Sun Belt | 18828 | 862 | 2.747 | 43 | 26% | 2.740 | 42 | -1 |
| 43 | North Carolina | ACC | 21422 | 982 | 2.750 | 42 | 32% | 2.718 | 43 | 1 |
| 44 | Georgia Tech | ACC | 17078 | 773 | 2.716 | 45 | 27% | 2.705 | 44 | -1 |
| 45 | Louisville | ACC | 18008 | 811 | 2.702 | 47 | 25% | 2.700 | 45 | -2 |
| 46 | Stanford | Pac-12 | 15498 | 705 | 2.729 | 44 | 33% | 2.695 | 46 | 2 |
| 47 | Texas A&M | SEC | 17380 | 780 | 2.693 | 48 | 27% | 2.680 | 47 | -1 |
| 48 | Maryland | Big Ten | 18526 | 837 | 2.711 | 46 | 32% | 2.678 | 48 | 2 |
| 49 | Illinois | Big Ten | 20941 | 939 | 2.690 | 49 | 29% | 2.671 | 49 | 0 |
| 50 | Colorado | Pac-12 | 11695 | 518 | 2.658 | 60 | 21% | 2.671 | 50 | -10 |
| 51 | Rutgers | Big Ten | 14762 | 655 | 2.662 | 58 | 22% | 2.670 | 51 | -7 |
| 52 | Liberty | Ind (G5) | 19283 | 862 | 2.682 | 52 | 29% | 2.665 | 52 | 0 |
| 53 | UNLV | MtnWest | 13106 | 586 | 2.683 | 51 | 29% | 2.662 | 53 | 2 |
| 54 | WMU | MAC | 18494 | 818 | 2.654 | 61 | 22% | 2.662 | 54 | -7 |
| 55 | Southern Miss | ConfUSA | 18192 | 803 | 2.648 | 64 | 23% | 2.653 | 55 | -9 |
| 56 | Penn State | Big Ten | 16756 | 745 | 2.668 | 55 | 28% | 2.652 | 56 | 1 |
| 57 | Memphis | AAC | 19066 | 851 | 2.678 | 53 | 31% | 2.649 | 57 | 4 |
| 58 | Bowling Green | MAC | 16804 | 749 | 2.674 | 54 | 31% | 2.647 | 58 | 4 |
| 59 | Buffalo | MAC | 18778 | 829 | 2.649 | 63 | 25% | 2.646 | 59 | -4 |
| 60 | Clemson | ACC | 21902 | 968 | 2.652 | 62 | 26% | 2.643 | 60 | -2 |
| 61 | Miami-OH | MAC | 15003 | 656 | 2.623 | 68 | 21% | 2.638 | 61 | -7 |
| 62 | Alabama | SEC | 17574 | 781 | 2.666 | 56 | 31% | 2.637 | 62 | 6 |
| 63 | Iowa | Big Ten | 18035 | 795 | 2.645 | 65 | 26% | 2.636 | 63 | -2 |
| 64 | California | Pac-12 | 16953 | 759 | 2.686 | 50 | 37% | 2.636 | 64 | 14 |
| 65 | West Virginia | Big 12 | 18052 | 793 | 2.636 | 66 | 27% | 2.625 | 65 | -1 |
| 66 | San Jose State | MtnWest | 17160 | 761 | 2.661 | 59 | 35% | 2.618 | 66 | 7 |
| 67 | James Madison | Sun Belt | 16897 | 738 | 2.621 | 69 | 26% | 2.613 | 67 | -2 |
| 68 | Tulane | AAC | 19239 | 839 | 2.617 | 72 | 27% | 2.604 | 68 | -4 |
| 69 | NC State | ACC | 20379 | 890 | 2.620 | 70 | 30% | 2.597 | 69 | -1 |
| 70 | Mississippi State | SEC | 18970 | 843 | 2.666 | 57 | 43% | 2.593 | 70 | 13 |
| 71 | Oregon | Pac-12 | 19205 | 835 | 2.609 | 76 | 29% | 2.588 | 71 | -5 |
| 72 | South Alabama | Sun Belt | 20576 | 895 | 2.610 | 75 | 30% | 2.588 | 72 | -3 |
| 73 | TCU | Big 12 | 23430 | 1015 | 2.599 | 78 | 27% | 2.587 | 73 | -5 |
| 74 | Ohio State | Big Ten | 17966 | 782 | 2.612 | 74 | 31% | 2.586 | 74 | 0 |
| 75 | Iowa State | Big 12 | 19278 | 845 | 2.630 | 67 | 36% | 2.584 | 75 | 8 |
| 76 | Michigan State | Big Ten | 15930 | 692 | 2.606 | 77 | 30% | 2.583 | 76 | -1 |
| 77 | Arizona | Pac-12 | 16728 | 729 | 2.615 | 73 | 34% | 2.576 | 77 | 4 |
| 78 | Purdue | Big Ten | 20210 | 882 | 2.619 | 71 | 35% | 2.576 | 78 | 7 |
| 79 | Boise State | MtnWest | 18567 | 794 | 2.566 | 80 | 22% | 2.573 | 79 | -1 |
| 80 | Washington | Pac-12 | 20660 | 893 | 2.593 | 79 | 36% | 2.545 | 80 | 1 |
| 81 | Kansas State | Big 12 | 21304 | 903 | 2.543 | 86 | 25% | 2.538 | 81 | -5 |
| 82 | Appalachian State | Sun Belt | 17919 | 761 | 2.548 | 85 | 27% | 2.538 | 82 | -3 |
| 83 | Missouri | SEC | 18426 | 783 | 2.550 | 84 | 28% | 2.535 | 83 | -1 |
| 84 | NIU | MAC | 18244 | 765 | 2.516 | 89 | 20% | 2.532 | 84 | -5 |
| 85 | Syracuse | ACC | 16406 | 700 | 2.560 | 82 | 32% | 2.528 | 85 | 3 |
| 86 | New Mexico | MtnWest | 15503 | 648 | 2.508 | 92 | 20% | 2.523 | 86 | -6 |
| 87 | Wisconsin | Big Ten | 16537 | 692 | 2.511 | 91 | 21% | 2.522 | 87 | -4 |
| 88 | Wyoming | MtnWest | 19231 | 803 | 2.505 | 94 | 20% | 2.522 | 88 | -6 |
| 89 | LSU | SEC | 20056 | 856 | 2.561 | 81 | 34% | 2.521 | 89 | 8 |
| 90 | South Carolina | SEC | 18082 | 771 | 2.558 | 83 | 34% | 2.519 | 90 | 7 |
| 91 | Florida | SEC | 19032 | 792 | 2.497 | 96 | 24% | 2.498 | 91 | -5 |
| 92 | Louisiana Tech | ConfUSA | 17808 | 751 | 2.530 | 87 | 33% | 2.493 | 92 | 5 |
| 93 | Auburn | SEC | 18284 | 754 | 2.474 | 99 | 20% | 2.492 | 93 | -6 |
| 94 | Miami | ACC | 18219 | 763 | 2.513 | 90 | 31% | 2.487 | 94 | 4 |
| 95 | UL-Monroe | Sun Belt | 16688 | 696 | 2.502 | 95 | 29% | 2.483 | 95 | 0 |
| 96 | Fresno State | MtnWest | 20309 | 855 | 2.526 | 88 | 36% | 2.477 | 96 | 8 |
| 97 | South Florida | AAC | 15533 | 640 | 2.472 | 100 | 23% | 2.477 | 97 | -3 |
| 98 | Eastern Michigan | MAC | 17498 | 727 | 2.493 | 97 | 30% | 2.470 | 98 | 1 |
| 99 | Florida State | ACC | 18612 | 769 | 2.479 | 98 | 28% | 2.464 | 99 | 1 |
| 100 | Houston | AAC | 19586 | 818 | 2.506 | 93 | 38% | 2.452 | 100 | 7 |
| 101 | BYU | Ind (G5) | 16701 | 685 | 2.461 | 101 | 30% | 2.439 | 101 | 0 |
| 102 | Vanderbilt | SEC | 17794 | 718 | 2.421 | 108 | 22% | 2.428 | 102 | -6 |
| 103 | UConn | AAC | 17335 | 695 | 2.406 | 109 | 19% | 2.424 | 103 | -6 |
| 104 | Arizona State | Pac-12 | 15580 | 638 | 2.457 | 102 | 33% | 2.421 | 104 | 2 |
| 105 | New Mexico State | Ind (G5) | 15299 | 613 | 2.404 | 110 | 21% | 2.418 | 105 | -5 |
| 106 | Ohio | MAC | 20896 | 848 | 2.435 | 103 | 30% | 2.410 | 106 | 3 |
| 107 | Pittsburgh | ACC | 23117 | 926 | 2.403 | 111 | 23% | 2.410 | 107 | -4 |
| 108 | Troy | Sun Belt | 20978 | 849 | 2.428 | 105 | 29% | 2.408 | 108 | 3 |
| 109 | UTEP | ConfUSA | 19881 | 795 | 2.399 | 113 | 22% | 2.406 | 109 | -4 |
| 110 | San Diego State | MtnWest | 18766 | 751 | 2.401 | 112 | 26% | 2.395 | 110 | -2 |
| 111 | Colorado State | MtnWest | 16869 | 681 | 2.422 | 107 | 32% | 2.392 | 111 | 4 |
| 112 | Charlotte | ConfUSA | 15207 | 616 | 2.430 | 104 | 35% | 2.389 | 112 | 8 |
| 113 | East Carolina | AAC | 18023 | 728 | 2.424 | 106 | 33% | 2.387 | 113 | 7 |
| 114 | Baylor | Big 12 | 21403 | 850 | 2.383 | 115 | 24% | 2.382 | 114 | -1 |
| 115 | Notre Dame | Ind (P5) | 21613 | 856 | 2.376 | 116 | 23% | 2.380 | 115 | -1 |
| 116 | Massachusetts | Ind (G5) | 16706 | 655 | 2.352 | 119 | 19% | 2.374 | 116 | -3 |
| 117 | Georgia | SEC | 23438 | 931 | 2.383 | 114 | 30% | 2.361 | 117 | 3 |
| 118 | Michigan | Big Ten | 22501 | 884 | 2.357 | 118 | 24% | 2.360 | 118 | 0 |
| 119 | Kansas | Big 12 | 19570 | 765 | 2.345 | 120 | 26% | 2.338 | 119 | -1 |
| 120 | USC | Pac-12 | 22898 | 906 | 2.374 | 117 | 35% | 2.330 | 120 | 3 |
| 121 | Duke | ACC | 20672 | 807 | 2.342 | 121 | 28% | 2.326 | 121 | 0 |
| 122 | Oregon State | Pac-12 | 20061 | 777 | 2.324 | 123 | 24% | 2.325 | 122 | -1 |
| 123 | Utah | Pac-12 | 21946 | 855 | 2.338 | 122 | 28% | 2.322 | 123 | 1 |
| 124 | Coastal Carolina | Sun Belt | 19642 | 752 | 2.297 | 124 | 28% | 2.280 | 124 | 0 |
| 125 | UAB | ConfUSA | 19176 | 727 | 2.275 | 125 | 24% | 2.274 | 125 | 0 |
| 126 | Navy | AAC | 17414 | 638 | 2.198 | 127 | 7% | 2.268 | 126 | -1 |
| 127 | Army | Ind (G5) | 19446 | 704 | 2.172 | 129 | 6% | 2.246 | 127 | -2 |
| 128 | Minnesota | Big Ten | 20683 | 756 | 2.193 | 128 | 20% | 2.209 | 128 | 0 |
| 129 | Rice | ConfUSA | 19984 | 735 | 2.207 | 126 | 30% | 2.185 | 129 | 3 |
| 130 | Air Force | MtnWest | 20380 | 714 | 2.102 | 131 | 6% | 2.172 | 130 | -1 |
| 131 | Kentucky | SEC | 21580 | 780 | 2.169 | 130 | 29% | 2.150 | 131 | 1 |
February 10th, 2023 at 3:17 PM ^
To add to this: I don't think incompletions alone are the story here, because it doesn't capture how teams in the middle really use tempo. Penn State actually moves pretty leisurely, but they like to pull out tempo after 1st downs or controversial plays, when they figure the defense might have lost focus. The different between the 50th and 75th team could be nil--they could be deploying the same tempo strategy but just getting fewer opportunities.
It's a curve, so the outliers are the only ones I really care about.

February 10th, 2023 at 2:46 PM ^
Great data. Very interesting. One comment, the percentile data is not actually the percentile team. For example the 65th team is Iowa and would be 50th percentile in terms of 130 teams. That led me to question what is the calculation you used to calculate percentile...
February 10th, 2023 at 2:59 PM ^
It's min-max--where you are on the curve.
February 10th, 2023 at 2:49 PM ^
Looking at the top teams as far as tempo, it seems like tempo might be more of a gimmick than sustainable against top teams. Look at Tennessee when tempo didn't work for them. Georgia was barely above Michigan.
February 10th, 2023 at 3:04 PM ^
USC is just one spot ahead of Michigan. That is a big surprise
February 10th, 2023 at 3:20 PM ^
I thought this was going to be about the overall pace of games, which is pathetic. NFL games are typically 30 minutes shorter due to shorter commercial breaks. That's ridiculous.
Please change, NCAA.
February 10th, 2023 at 3:32 PM ^
Lets hold breath until someone blames it on Weiss.
Comments