denard robinson then revived tacopants just to kill him again

WITH SPECIAL GUEST DENARD ROBINSON. FOR THE WHOLE THING! Big thanks to Bryan Fuller for setting that up. Please listen to Part 1 first if you haven't already.
The Sponsor: If you're buying or reselling, talk to Matt Demorest at HomeSure Lending now and see if you can't lock in a low rate while it lasts. In addition to being more ethical, knowledgeable, hands-on, intelligent, and fun to work with, Matt's cool.
Previously: 1879, 1901, 1918, 1925, 1932, 1940, 1947, 1950, 1964, 1973, 1976, 1980, 1985 p.1& p.2, 1988, 1991, 1999, 2011 p.1
Special Guests: Craig Roh, author of The Pass Rush Bible and Denard Robinson
[Writeup and player after THE JUMP]
Previously: Krushed By Stauskas (Illinois 2014), Introducing #ChaosTeam (Indiana 2009), Revenge is Terrifying (Colorado 1996), Four Games In September I (Boston College 1991), Four Games In September II (Boston College 1994), Four Games In September III (Boston College 1995), Four Games In September IV (Boston College 1996), Pac Ten After Dark Parts One and Two (UCLA 1989), Harbaugh's Grand Return Parts One and Two (Notre Dame 1985), Deceptive Speed Parts One and Two (Purdue 1999)
Week One: 1993 Washington Part One, Part Two, 2002 Washington Twitch stream
This Game: Condensed game, WH highlights, box score, MGoPreview, Denard After Dentist, Offense UFR, Defense UFR, a Notre Dame fan's live blog
Part One: Click here
REMINDER: WE WILL BE STREAMING THIS GAME WITH COMMENTARY AT NOON EASTERN TOMORROW ON TWITCH, THERE WILL BE A POST ON THE FRONT PAGE
Michigan is down 17-7 at halftime and without a couple Tommy Rees interceptions it could be much worse. David Pollock says the Wolverines have "gotta go sandlot" in the second half, which every M partisan agrees with wholeheartedly. ESPN airs highlights set to "Something to Believe In" by Parachute, a band not memorable enough to place this game in its time from the segment alone.
To make matters worse, Notre Dame receives the second-half kickoff and immediately reestablish two themes from the first half. Michael Floyd gets a quick first down, prompting Kirk Herbstreit to state "he’s a tough matchup for any secondary but especially this Michigan secondary," which isn't particularly subtle. Then Cierre Wood bursts for another chunk gain as Mike Martin and Ryan Van Bergen are clubbed out of the hole. Brent Musburger notes ND is now leading in total yardage 298 to 90.
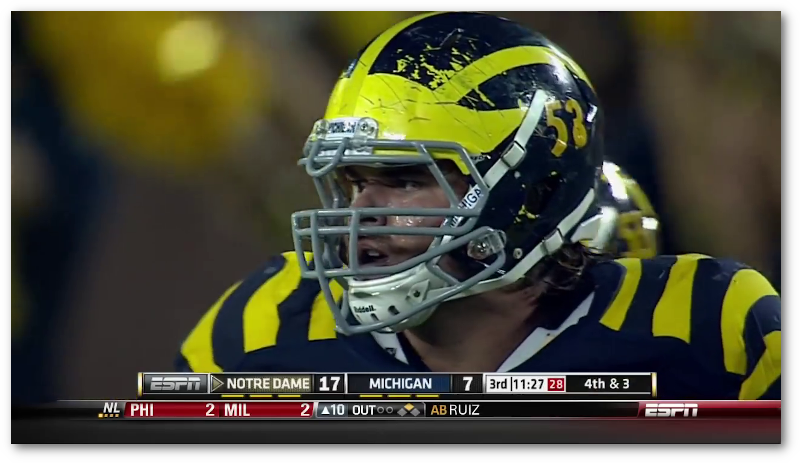
Following back-to-back short completions to Floyd, though, Van Bergen breaks through for a third-down TFL. Brian Kelly chooses to punt on fourth-and-three from Michigan's 43, a conservative call that nearly backfires in two ways: punter Ben Turk salvages a bouncing snap and bobbles it just long enough that he technically isn't down while he picks it up. Instead of Michigan getting the ball near midfield, Jeremy Gallon fair catches the ball at the ten.
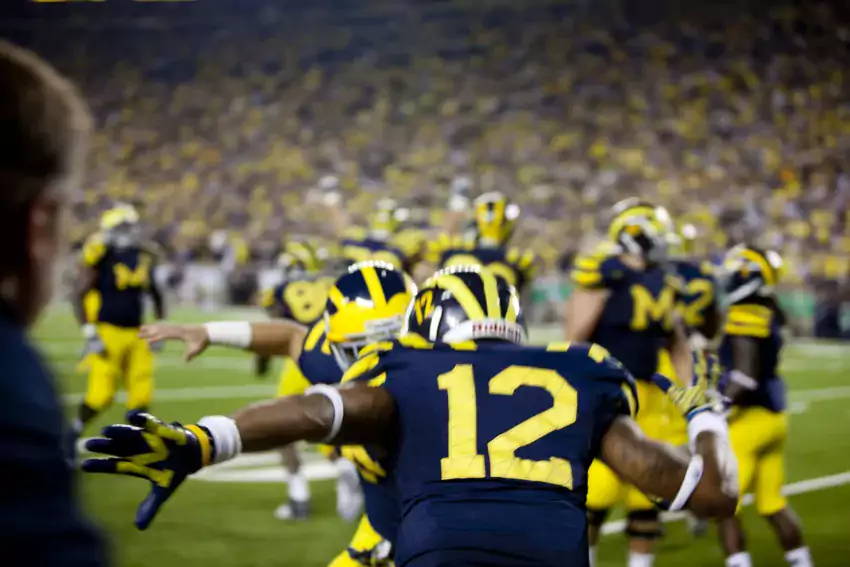
Denard Robinson immediately picks up 39 yards on a zone read keeper—of sorts, since Al Borges has his offensive line block both defense ends, so the read is more a hope that Manti Te'o will choose the wrong gap, and he obliges.
"So the Irish better get ready," says Musburger. "Here comes number 16."
[After THE JUMP: Here comes number 16.]

Dilemma: The HTTV proofs were delivered at the same time as the game.
First a confession: the last time I bought EA's college football game was 10 (the 2009 season) for PS2. I used to get it every year from the Woodson cover to the Desmond cover and play until it was taking more time than I could excuse because an exercise bike was involved. The exception was '05, which I played for four days before going back to 2004, still the gold standard of the series.
The versions I had were all great for power runs to set up bombs but in the summer of 2009 I was mostly interested in wrecking offensive rushing records with Rich Rod's offense. Like anybody with a touch of ASD, I cannot play until I've filled in and fiddled around with Michigan's rosters. Tate Forcier was like an 80 overall when I was done. Denard was probably set to move to cornerback—remember this was the 2009 offseason, when old men in conference hotels were dancing to Weapon of Choice:
Then I started playing and videogame Forcier would throw 8 interceptions per game because linebackers could leap 100 feet in the air. There was no such thing as an incomplete pass; you threw screens or you threw interceptions. It took just three games for my frustration to turn me off from the series and turn me into one of those people who delights in The Consumerist ripping on EA. Other than goofing around on my 2004 dynasty NCAA the game was dead to me.
Then they put Denard on the cover (and the wife let me get a PS3 once I proved how awesome it is at Netflix). And since I'd moved on from guy at convention hotels to guy who works for a college football blog, it turned out I could get an advance copy of the thing with Denard on the cover in return for telling people how I felt about it. A part of me finds it ridiculous that I can get away with this. Since I've been out of things for awhile (and Misopogal has grown skeptical over all this "work" I've been putting in) I'm gonna deliver the game to Ace after I post this, and next week you'll get a review from someone with a frame of reference within the current console generation. Here's the things you should know now:
1. IT HAS DENARD ON THE COVER. Truly it is the most beautiful thing to grace a cover since...NCAA 06? NCAA 99? A baby swimming toward a dollar on the album where music got its balls back? If Denard was smiling maybe.


I adore all of you!
He is actually the most appropriate cover athlete for a version of this game since they put Ricky Williams on the one with unstoppable running backs because…
2. OPTION OFFENSE is awesome. They completely redid that and now read options work the way they're supposed to. EA also gave the defense its option-crushing corner blitzes and scrape exchanges.

I keep forgetting to sub Green in at FB
However the counter to the counter sucks. They put bubble and PA split end screens in the playbook, but the defense reads these way too quickly on any difficulty worth playing. Also I've found my skill position guys tire so fast that when I go to it I keep getting Jeremy Jackson. Anyway the option stuff is the most fun, specifically the read and triple options. Too bad Michigan went back to the future on offense since...
[after the jump]
4