Week #5 National Rankings, Fremeau Efficiency Index, and Sagarin Predictor for MSU
 Synopsis: After 5 games, Michigan is currently ranked #9 in scoring offense and #73 in scoring defense. Based on these rankings, M has a 43% chance for a +5 WLM (9-4 or better) season and an 83% chance for a winning season. Offense continues to trend better each week. Defense, uh, not so much. The defense is definitely a significant concern. Only 8 teams in the last 5 years have had +5 WLM with a defense rated worse than #60. The most recent were in 2008 (Texas Tech O#13/D#74 +9 WLM, Oregon O#15/D#78 +7 WLM, Missouri O#6/D#69 +6 WLM, Nebraska O#25/D#80 +5 WLM, Oklahoma State O#17/D#76 +5 WLM). Michigan's current PPG is 25.4 so the defense must hold teams below this number to improve their performance.
I always use scoring stats because yardage stats are inherently flawed. Poor teams will give up fewer passing yards and more rushing yards because opponents will stop passing once they have a late-game lead and will run out the clock instead. For winning teams, the opposite is true. Yardage per game does not take into account the pace of the game and it is obvious M plays at a faster pace than most teams (M is ranked #82 based on yards per play). Being #73 in scoring defense is not good but Ms defense is not as bad as the #102 in total defense indicates. According to the S&P+ rankings at Football Outsiders, Michigan is ranked #62 in total defense. 
Based on the FEI (Fremeau Efficiency Index), Michigan is predicted to win between 8.6 and 9.4 games (excluding bowl game but adjusted with +1 for M's one FCS opponent).
Based on the FEI, M is favored by 8 points over MSU! Using the Sagarin Predictor, M is favored by 5.6 points (Vegas Odds Opened at 5.0). This is a classic "pick-em" game with the advantage going to U/M based on home field advantage and a slightly more difficult schedule to date. Michigan needs to play well but does not need that "perfect game" to beat Sparty.
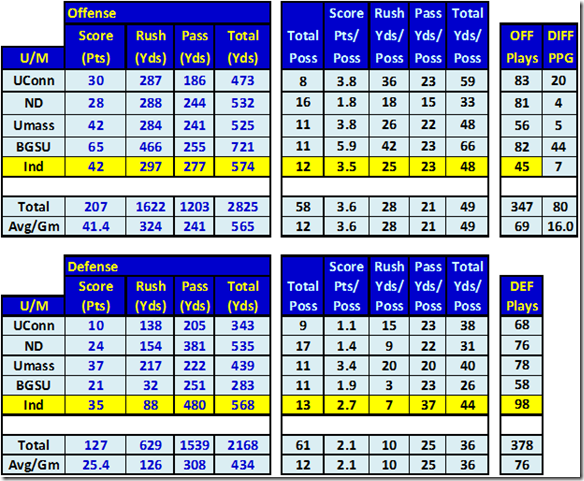
 Overall this year, M is averaging 3.6 points per possession (PPP) and 49 YPP. The defense is giving up 2.1 PPP and 36 YPP. With an average of 12 possessions per game for each team, this translates into an 18 point advantage for Michigan.
DETAILS: Here are the FEI numbers ( FEI Forecasts and Football Outsiders FEI ). FEI is a weighted and opponent adjusted season efficiency and is expressed as a percentage as compared with an average FBS team.
Note that FEI completely excludes all non-FBS data (the W-L record is only for FBS games, etc.). Therefore, you need to add 1 to the projected numbers for MW and RMW to get the final predicted wins for M this year.
The FEI is a drive based analysis considering each of the nearly 20,000 drives each year in college football. The data is filtered to eliminate garbage time (at the half or end of game) and is adjusted for opponent. A team is rewarded for playing well against good teams (win or lose) and is punished more severely for playing poorly against bad teams than it is rewarded for playing well against bad teams. I've included the GE basic data so you can see the impact of adjusting for opponent. (See: Football Outsiders Our Basic College Stats )
Here are the Sagarin Ratings.
Sagarin uses two basic ratings: PREDICTOR (in which the score MARGIN is the only thing that matters) and ELO-CHESS (in which winning and losing only matters, the score margin is of no consequence). The overall rating is a synthesis of the two diametrical opposites, ELO-CHESS and PREDICTOR.
Per Sagarin: ELO-CHESS is “very politically correct. However, it is less accurate in its predictions for upcoming games than is PREDICTOR”.
Here is the U/M vs. MSU National Statistical Rankings with the advantage for each category indicated (all categories within 10% are considered a "push").
Here are the week by week National Statistical Rankings for Michigan (cumulative thru the week indicated):
I have included the major rankings for offense and defense but scoring rankings show the best correlation to winning and losing. Scoring rankings are based on PPG. Rushing, Passing, and Total rankings are based on YPG.
Here is the basic data for Michigan (each individual week followed by totals and then average per game). I've included Total Possessions for Offense & Defense along with the calculated data per possession. Number of possessions do not include running out the clock at the half or end of game. Offense Plays and Defense Plays are better indicators than Time of Possession.
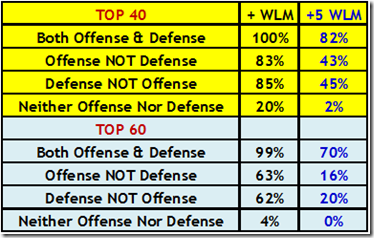
Using Scoring Offense and Scoring Defense National Rankings for the past 5 years (FBS AQ teams only), this table shows the percentage of teams that finish the season with a +WLM and a +5 WLM. For example, teams that finished in the Top 40 in both offense and defense had a 100% chance to be +WLM and an 82% chance to be +5 WLM (9-4 or better).
Each year, of the 66 FBS AQ teams, 65% (43 teams) end up with a + WLM and 36% (24 teams) end up with a +5 WLM.
October 8th, 2010 at 9:26 AM ^
what does the sagarin line translate into in terms of percent chance of a win against MSU?
October 8th, 2010 at 3:48 PM ^
I don't know. FEI gives a % probability but not sure anyone else does.
October 8th, 2010 at 9:44 AM ^
I could be wrong, but I don't think you need to add 1 to the RMW column, as it's projecting the remaining games we win, and we have no remaining games against non-FBS teams.
Also, right below the section where you talk about Sagarin, I think you need to change "Indiana" to "MSU".
October 8th, 2010 at 3:53 PM ^
FEI completely ignores any non-FBS games. So, you do have to add 1. (I got lazy, the FEI column is actually titled FBS MW and FBS RMW -- I'll add that next week to avoid any confusion.
October 9th, 2010 at 1:20 PM ^
I realize FCS games are thrown out, but RMW stands for "Remaining Mean Wins" which implies it's a projection of how many of the last 7 games we win. And none of those 7 games are against non-Big 10 teams.
4.4 means it's projecting us to have 9.4 wins at the end of the year. I'd be surprised if it projects more than 0.75 combined between Iowa and OSU, and figure UW, MSU, and PSU are roughly 0.6-0.7 each (I assume the 71.9% in the table means UM is projected to get .719 wins today). That leaves Purdue and Illinois to be 0.8-0.9. So, by my rough calculations:
0.75 + 3*0.65 + 2*0.85 = 0.75 + 1.95 + 1.7 = 4.4
Even on the Football Outsiders site, it says:
FBS RMW: Mean Wins expected for only the remaining games on the given team's schedule.
October 8th, 2010 at 10:52 AM ^
what the likelyhood for a WLM or a WLM +5 is for a highly ranked defense vs. a lower rated offense? Just curious what a team that is "opposite" of our current situation looks like.
October 8th, 2010 at 10:58 AM ^
-
Don't need to add 1 to RMW, as it's remaining mean wins. Already accounted for in just MW.
-
Does looking at Yards Per SCORING and NON-SCORING Possessions add anything to the analysis? For instance, Opponent YPSP ends up averaging around 66 yards, whereas Opp. YPNSP is around 19 yards.
-
Do the PPP stats disregard non-offensive scores (ie, safeties, punt/kick returns, INT returns, D fumble returns)? Does returning a kickoff or interception count as a 1-play possession?
-
Officially, it's "U-M" (per the University website). Just saying, because "U/M" just looks really funny. ;)
October 8th, 2010 at 4:01 PM ^
1. FEI completely ignores any non-FBS games. The column on the site actually is titled FBS MW and FBS RMW (note that U-Ms records is just 4-0 instead of 5-0). So, you do need to add 1.
2. Hmmm, I'll have to look at that.
3. I am using the official stats from the MGoBlue website and subracting end-of-half/end-of-game clock kills. When Stonum returns a KO for a TD tomorrow, I'll have to look at the stats to figure this out. The folks at FO don't count any data for any possession that is in "garbage time" which means less possessions. Not sure on the exact criteria for FEI but the S&P+ folks use for non-garbage time:
a game within 24 points in the first quarter, with 21 points in the second quarter, and within 16 points in the second half.
4. Well, then U-M it is.
October 8th, 2010 at 10:02 PM ^
In the boxscore for the ND game last year, the KO Return by Stonum appears as a "drive" but does not have a starting field position and no time elapsed. Ending field position is the ND00 yard line (TD). Also, no yardage is recorded to rushing or passing or total offense. So, I would subtract that and it would not be a possession.
BTW, that would be the only way one team could end up with 2 (or more) possessions than the opponent.
October 8th, 2010 at 2:09 PM ^
Fremau predicts Michigan by 8:
71.9% PWE; MICHIGAN 30, Michigan State 22
http://bcftoys.blogspot.com/2010/10/fei-forecasts-week-6-oct-5-oct-9.ht…
October 8th, 2010 at 3:39 PM ^
Just got to AA after my 4 hour drive. I am surprised (pleasantly) at the 8 point spread!
I've updatd the diary.
October 8th, 2010 at 3:58 PM ^
Just got here after my four hour drive also....this game has me so damned nervous. Games are supposed to be fun...why do I fell like I need valium to calm down.
The numbers are somewhat comforting...let's just hope tomorrow's statistics confirm what the numbers suggest. If nothing else, the bars are open tonight and tomorrow.
Go Blue!
October 8th, 2010 at 5:38 PM ^
I look forward to these threads every week. Thanks
October 9th, 2010 at 4:42 AM ^
I am curious as to how accurate these predictions (Sagarin, etc) end up being.......there are a lot of stats that I'm just beginning to try and understand.......but looking back historically, how good of a "predictor" are these charts?
Thanks and keep up the great work!


Comments