Statistics
[Editor's note: frontpaged for obvious reasons. A scheduling mix-up with Brian caused this to get buried earlier, so I'm bringing it back near the top. [How much] Will Michigan rue the loss of Brandon Graham? - Tim]
[Note: I have 2006 fully loaded into the database now and will be included in all future multi-year studies along with 2007-2009.]
We can all agree that sacks and interceptions are good things for the defense and bad things for the offense. But how does a viable pass rush or a ball-hawking secondary affect the performance of the opposing offense on plays where there isn’t a sack or a pick. Likewise, what is the correlation between an offensive line that gives up sacks regularly or a mistake prone quarterback?
Defense
Sacks and interceptions have very similar direct impacts on games. From 2006-2009 in games between two D1 teams in competitive game situations (the “universe” for this and most of my analysis) the average defensive unit produced 2.3 ppg worth of sacks and 2.0 ppg worth of interceptions. Sacks have a slightly higher direct value than interceptions (interceptions returns and fumble returns on sacks are not included) but does either of these correlate to a better defensive performance overall.
Chart time? Let’s make it a double.


Not entirely surprisingly, the better a defense is at producing sacks and interceptions, the better it is on downs where neither occur.
For every point per game that a defense generates due to sacks, the overall pass rush generates 1.2 ppg of additional value. Interceptions are also powerful, but not as much so. Each ppg of value a defense generates through interceptions is worth 0.9 ppg of additional value.
This analysis serves to confirm what most football fans already know. Teams that can create interceptions and sacks are good going to be better defensive teams. Whether a strong pass rush/secondary creates pressure on other downs or if strong pass rushes and secondaries are a common occurrence on great defenses is irrelevant. As most of you probably know, defenses that are good at these two things are also good on other downs. So why is this interesting…
Offense
The story becomes very different when you look at offenses. The conventional wisdom that was supported for defenses is largely blown up on the offensive side of the ball. Sacks and interceptions may be indicators of great defenses, but they are not symptoms of bad offenses.


The slope of these two charts are about 20% of the gradient of the corresponding defensive charts and virtually flat. On offense, the amount of sacks and interceptions are largely independent of performance. There is obviously the immediate negative effect of the play, but giving up sacks or throwing interceptions show virtually no correlation to success or failure on other downs.
What it means?
For one of side of the ball it merely quantifies conventional wisdom. Good pass defenses get interceptions and sack the quarterback and teams that get interceptions and sack the quarterback are often good pass defenses, even on other plays. The value they create is roughly equal to value created by the big plays.
On offense, it’s a very different story. Interceptions and sacks will always be bad plays for an offense, but their rate of incidence is not strongly correlated to performance on other downs. In fact, if given the choice between a quarterback who threw a lot of picks the prior year but was generally successful otherwise and a quarterback who was very safe but not all that productive, my guess is you will be better of going for the quarterback with the picks.
Special thanks goes to Ty and The Lions in Winter who has been working on a similar line of reasoning for the Lions revamped defensive line.
Potential Future Diaries
Just some ideas I am kicking around or have half started. Let me know what you think about these or any other things you would like to see.
- A follow-up piece on fourth downs digging deeper into how the decision making changes based on the relative strengths of the offense and the opponents defense
- A broader look at “luck”, looking back over the last four years.
- When are extra yards not worth it. The secret dead zones of football.
- Probably not for several months, but a big season preview is in the works.
- Something Carr vs. Rodriguez, now that I have 2006-2007 seasons of data I have two years to compare the two more directly.
- How the best players of the last four years (TEBOW!!!) progressed over the years. Maybe a companion piece on Michigan defenders.
- Any other suggestions? An article a week means I need all the ideas I can get, I’m not afraid to beg!
[Ed: This week's Mathlete column expands on fourth down decision-making. I haven't seen a graph anywhere near as clear as those included below about how shifting the parameters of the offenses and defenses in question makes major impact on what a correct decision is. This is not a situation where you can just read the decision off a chart. Feel and personal preference will always play a role. It's a complex decision.]
Last week I wrote on the value of special teams but a very interesting side topic arose: fourth down decision making. It started with this chart:

About which I remarked:
The going for it actually peaks between 30 and 35 as more coaches don’t really know what to do so they just go for it.
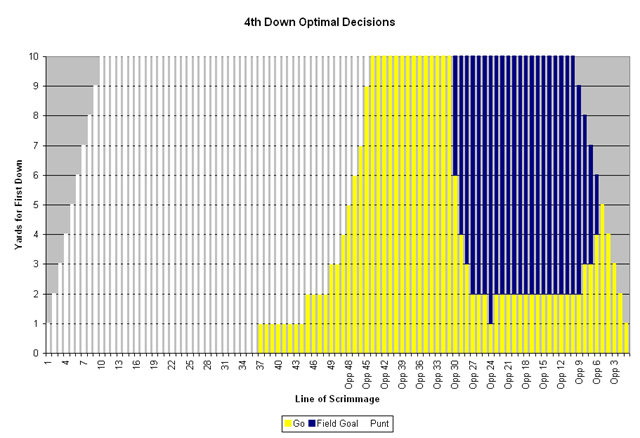
So I decided to look and see what the decision chart should look like on an expected points basis.

Anything close to two different colors is a virtual toss-up. Any gains near a color transition are negligible and not worth noting, but there are very real gains to be made in the heart of the yellow section, where coaches are taking their offenses off of the field far too quickly.
A couple of quick rules of thumb:
- Don’t punt on the opponent’s side of the field.
- Really consider going for it on 4th down after crossing your own 40.
- Field goals only make sense if there are more than 5 yards to go and you are between the 10 and 30 yard lines. If you’re in opponent territory and these two criteria aren’t true, you should be going for it.
I know this is not the first time a topic like this has been presented, David Romer was mostly criticized for his paper on the topic a couple years back (thanks for the reminder Colin). [Ed: Not around here.] Of course there was the great Patriot debate last season when the Patriots elected to go for it on 4th and 2 with the lead in their own territory. Even though the majority of the arguments against this work amount to "people like David Romer and The Mathlete don’t know anything about football and just live in their parent’s basement" I did want to look at the main objections and see if they had any validity.
Objection 1: Does not account for “quick change” momentum
Below you’ll see a chart of the expected points on a drive based on field position, and how teams have actually fared. I also included drives obtained by turnover as comparison to the other “quick change” drive source.

There could be a case that drives started on a short field due to a 4th down stop generate more points than normal drives, but the small sample size reduces how strongly that argument can be made. From 2007-2009, the total points accounted for on drives obtained by 4th down stops (2523) is less than the projected points would be for any drives starting at the same field position (2580). This difference is meaningless statistically, something very damaging to the idea "momentum" helps the opposing offense after their defense gets a fourth down stop.
Adding in the turnovers does nothing to build a case for momentum after big defensive stops or turnovers. The turnover-started drive line tightly hugs the average line. As a whole, the turnover expected points line is slightly higher than the average line, but only by enough to generate an extra touchdown every 50 drives. That's about one every two years or so.
Although it can often feel like there is a big momentum swing after a big stop or turnover, there is scant evidence that it is more than our memories selecting the most traumatic or exhilarating scenes to hold onto. [Ed: for an example of this human tendency to ascribe meaning to unusual events where there is none, see any of the zillion "hot hand" studies.]
Objection 2: It assumes all offenses and defenses are average
To get a gauge on what “good” can mean in comparison to average, I plotted the best offense and best defense of the last three years against the average team’s expected points per drive.

As a rough approximation, the best offense is about a 1 point per drive better than average and the best defense makes offenses about a point worse per drive.
Scenario 1: Good offense

If your offense is as good as Florida, you should never punt against an average defense. Maybe if you are deep in your own territory, but only in the most extreme situations. This assumes that a new first down gives the Florida offense an extra point over an average team in expected value and a 10 percentage point increase in the likelihood that they convert.
A punt is conceding any chance of scoring and an offense this good should not give up that right so easily. This is the basic philosophy behind the vaunted no punting HS coach in Arkansas. His team isn’t necessary good because he doesn’t punt. He doesn’t punt because his offense is good. Why waste another scoring opportunity?
Scenario 2: Going against a good defense
Playing against a good defense changes the dynamic extensively but it does not mean forgoing the fourth down attempt altogether. With a reduced likelihood of success on 4th down and a reduced payout if the conversion is successful, the 4th down attempt still is an optimal strategy more than is currently utilized. Even against a top national defense, you should still not punt in opponent territory. The field goal becomes a more viable option against the stronger defense and punting becomes a much better idea all the way out to midfield.
[Ed: I think this is moving towards correct strategy since it takes a caveman or a seriously long-yardage situation for someone to punt from inside the opponent's 40 these days. That range from midfield to the opponent 40 is a spot we might see move towards fourth-down aggression in the next few years.
Also note that coventional current strategy gets way less wrong once you ramp up the ability of the defense. If we jacked it up even farther, it might get to the point where punting from the 36 (or even on third down) is a good idea. The flaws in strategy here are leftovers from an era when punting was actually the best option. Thinking has not kept pace with scoring since.]
Scenarios 3/4: Good defense or opponent good offense
The conventional wisdom is that if you trust your defense, you don’t go for it on fourth down. [Ed: In my experience the conventional wisdom is remarkably malleable on this point. If you have a good D and the announcer agrees with the call, the good D will be cited as a reason why.] In reality, the strength of your own defense (or the strength of the opposing offense) is largely irrelevant to the decision. Fourth down decisions are all about offensive opportunity. A 4th down decision to punt is the decision to take the ball out of your offense’s hand, leaving the relative impacts on your defense to negate each other. A 4th down failure puts your defense in a worse situation, but it doesn’t guarantee points for the other team; a good defense is still a major asset in stopping or limiting the other team with good field position. A punt doesn’t guarantee that the other team is going to be stopped, but a good defense makes it more likely. In the end, it’s still all about the offense.
Objection 3: Does not account for game specific situations
This objection does ring true, but its application is much narrower than most people believe. The main flaw with the expected points model is that for most of the game all points are largely equal but at the end of the game, a field goal or even time can become crucially important. If a field goal can tie a game, take the lead, or move said lead from one possession to two (or vice-versa), the decision-making process suggested above can shift radically. This could mean punting near midfield to prevent a short field goal drive for the other team or taking a field goal instead going for it on fourth in field goal range.
These situations are rare, however, and only come into effect in the fourth quarter. When there are likely to be even 2-3 additional possessions, the expected points model still holds up.
Another potential game situation not accounted for above is the presence of a high quality field goal kicker. A very accurate field goal kicker will move the blue field goal “bubble” in the above charts down, making fields more practical in short yardage situations. An above average kicker from long range will move the bubble left. Even a great kicker won’t make kicking inside the 5 practical in very many situations.
Conclusion: In Which Romer Is Re-Iterated
Teams need to be using kickers and punters less and their offenses more. Especially teams with good offenses. If you have a good offense, bringing out the punter should only be done in long distance situations or when deep in your own territory. Scoring touchdowns is the valuable thing in football and giving away a quarter of your plays to kick on fourth down greatly reduces your ability to score them, the gain in field position from a punt is worth less than it is currently perceived to be and the idea that momentum is obtained from a quick change of possession is to be slight at best and most likely non-existent.
One final thought I haven’t been able to quantify yet: if you switch to a fourth down mindset, what opportunities does it open up in play calling during the first three downs of a series. Planning on four plays for a first down instead of three would surely have some value for an offense to adjust and re-optimize their play calling, and the total offensive value could become even greater.
Note: apparently Brian Burke at Advanced NFL Stats and I have been having some of the same offseason thoughts as he just put up another piece on 4th down decision making, and this after we both introduced similar defensive player evaluation metrics within a month of each other.
[Ed: meant to bump this sooner but there was a lot of stuff yesterday.]
After the disastrous offensive performance of 2008, the 2009 Wolverine offense really had nowhere to go but up. Using my offensive ratings, the 2008 Michigan offense was 7.4 points per game below average, 107th out of 120 FBS teams. 2009 brought another year in the system and real quarterbacks and huge improvements. While far from consistently excellent, Michigan moved up to a modest 1.2 points per game above average, 50th nationally. No one outside of the eternal optimists like Fred Jackson could see another 57 place ranking improvement, but what has happened to teams that have shown big offensive improvements in year in the following year.
Presently my database has the 2007-2009 years completed, just enough for a 3 year case study. From 2007 to 2008 there were 28 teams that improved offensively by at least 5 points per game. I broke those team into three categories, teams that saw a second major (+5) increase in the third year, teams that saw a major (-5) regression back in the third year and teams that were in the middle and didn’t necessarily continue gaining, but didn’t fall back much either.
The Regressers
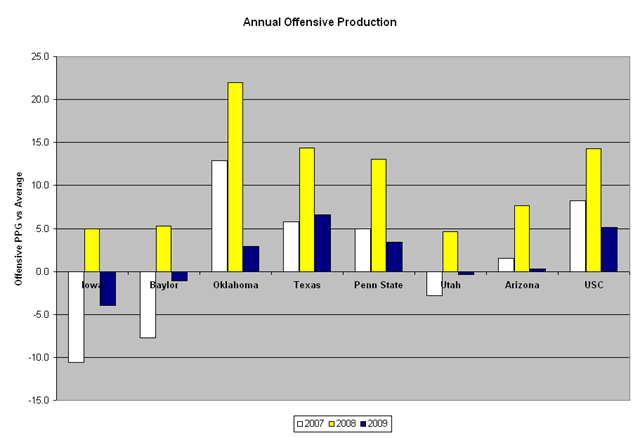
*Only BCS teams shown
With 14 of the 28 teams in this group, half of the teams that show big gains can expect a return to the mean the next season. In fact, these teams were worse offensively in 2009 than they were in 2007, let alone the beacon season of 2008. The average team in this group was 2.5 points per game worse in 2009 than they were in 2007 before they peaked.
The closest thing to a consistent thread is the quarterback possession as five of the eight, Oklahoma, Baylor, USC, Arizona and Utah, spent most or all of the season with a new quarterback.
In general, the regressers look like a group that is just regressing to the mean and that replacing a quarterback is damaging when your success has not been sustained for longer than a single season.
The Holders

With the exception of Alabama, these teams were pretty average in returning starts and had no major position group gaps to fill. Alabama had a new quarterback and was 97th in returning offensive starts nationally, the ability to sustain the offensive success is likely attributable to the influx of talent Saban brought into Alabama since he arrived.
The Gainers
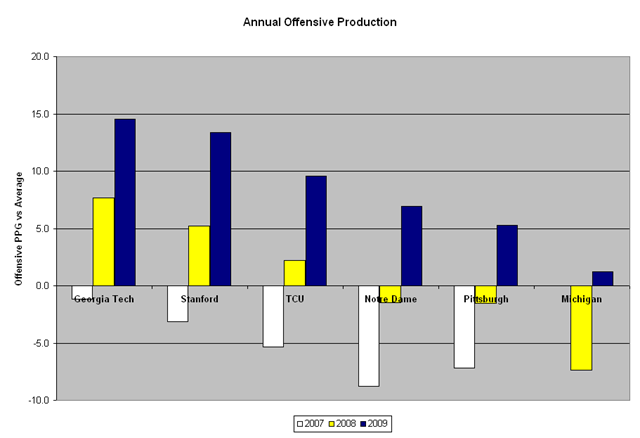
*Michigan 2007 results omitted (-1.1)
With a relatively new coach and a total offensive system overhaul, Georgia Tech is clearly the most similar situation to Michigan and their path is one that Michigan would be thrilled to follow. Tech went from –1.1 ppg in 2007 to 7.6 in 2008 to 14.5 and my top rated offense in the country in 2009. Even though Johnson and Rodriguez were hired the same year, the Michigan offense is about 2 years behind Georgia Tech. Georgia Tech went from average to very good to best in the country. Michigan went from average, to very bad and back to average. Even with the offset timeline, Michigan seems comparable to Georgia Tech’s situation and therefore a second year of offensive gain seems very possible under this comparison.
All five of these teams either returned 20+ starts at the quarterback position (except GT who had the same quarterback from the start of the system), although Stanford’s returning quarterback was replaced. The other major similarity between these schools in neither of the last two years did they have stratospheric gains, there is less flukiness to these teams success.
When looking at the progression from very bad to roughly average, there are four BCS level schools who showed that same progression. Three of those (TCU, Notre Dame and Pittsburgh went on to see big gains in year 3 as well, and NC St still saw modest improvement. Teams fitting this profile for a potential second year of strong offensive progress in 2010 along with Michigan include Kentucky, UConn, Wake Forest and Mississippi St.
Conclusions
Although teams that show a big jump like Michigan last year are more likely to fall back than continue the progress, the recruiting profile, experience at quarterback (even if the returner loses his job), progressions comps and system change all point to Michigan as being a good candidate to at least sustain and probably show more improvement next year. Every 3 point gain is worth about one additional win on the season and based on this look I would say that from the offense alone, a 3 point gain seems likely and a 6 point gain entirely possible.
63