TCU Projections

Methodology
I'll just start by reiterating the quote that there are lies, damn lies, and statistics. Also, I am no actuary, but I know my way around basic statistics. I thought it would be an interesting idea to look at relative performance and how it might predict this game. Hopefully this analysis is marginally more predictive than performance by opponent color.
The basic idea will be easier to boil down if I explain for a single statistic and team. So let's pick points scored in the first quarter for/against Michigan. My first step is to look at Colorado State's schedule and scrape the box score for every game they played against an FBS opponent. From there, I calculate that CSU averaged 3.1 points scored and 6.5 points allowed, with standard deviations of 4.5 and 6.9, respectively. Given that Michigan outscored CSU 10-0 in the first quarter, our Z score was 0.50, and our Z score against was -0.68. Once that calculation is done (for the entire box score), I move on to do the same for Hawaii, and so on. Then the same for TCU's schedule.
I treat this Z score as a measure of our relative performance. When projecting how many points we will score in the first quarter, I see that our offense averaged 0.66 standard deviations above the mean points our opponents allowed. So our expected score in the first quarter would be TCU's average against (5.4) plus 0.66 times their standard deviation (4.8), for an expectation of 8.5 for the good guys in Q1.
This measure itself has a standard deviation of 0.77. So a 50% confidence interval is bounded within 0.674 times that value, meaning we would expect our relative performance to be between 0.14 and 1.18 standard deviations above the mean (between 6.9 and 10.2 points). The same methodology gives us a 75% confidence interval of 5.8 to 11.3 points, and a 90% confidence interval of 4.6 to 12.5 points.
I didn't adjust for the sample size, and I don't feel like rerunning the analysis. The t adjustment would also be slightly different for us than it would be for TCU, as they played an FCS opponent. Suffice it to say, were it done, this adjustment would very slightly widen the confidence interval (~0.01 standard deviations on either side in this example).
Now all of the above is from the lens of Michigan offense performance relative to its opponents, then applying that to TCU's average. A converse lens would be to view TCU's performance relative to its opponents, and apply that to Michigan's average. I wasn't sure the most appropriate way to transpose these expected values and confidence intervals, but a midpoint seemed reasonable to me.
When charting out these projections, I created a custom "telescoping box and whisker" chart to illustrate these overlapping ranges, with the expected value taking up full width, the 50% interval taking up half width, the 75% interval taking up a quarter width, and the 90% interval taking up a tenth width.
For some of the small counting statistics, I used the same mean and standard deviation metrics, but I instead used a cumulative distribution function to calculate probability of a value less than 0.5, between 0.5 and 1.5, and so on.
Averages
Let's start with the simple stuff. Below are the mean and standard deviation for each statistic analyzed. Converted TOP here is in seconds.
Michigan
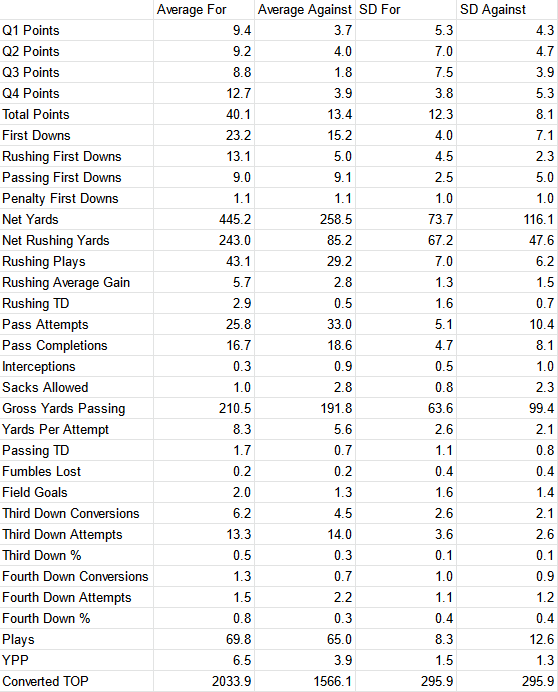
TCU

Z Tables
The below tables show how many standard deviations from that team's average we (or TCU) did in the game we played against them. Mostly you want big green numbers on offense and big red numbers on defense, with a few exceptions (e.g. Interceptions).
Michigan
Our trends won't be particularly surprising, as most of us have watched this team all year. We score above the opponents average in every quarter and overall, and on the flip side allow below average points in each quarter, most notably Q3. We get more first downs than teams allow, mostly on the strength of the ground game. We do not give up many first downs, but when we do, it's mostly through the air. We dominate the rushing game on both sides of the ball in both yards and touchdowns. Our passing attempts, sacks, and interceptions all tend t o be below average, yet our yards, YPA, and TD end up slightly above average. Conversely, teams pass more than average against us, and get fewer yards, YPA, and TD. We attempt fewer 3rd and 4th down conversions than average, yet succeed on more than average. On defense the opposite is true. Despite running fewer plays than teams allow on average, we control the clock, and our yards per play are on average more than one standard deviation above what our opponents allowed. Conversely, our opponents also run fewer plays than average, but are not able to control the clock, and struggle with yards per play.
For

Against

TCU
From the perspective of this analysis, TCU is much closer to average in every statistic, with only a handful of statistics where they are even half a standard deviation from the average on either side of the ball. As far as scoring, they do slightly outscore the opponent average each quarter and overall, while allowing slightly fewer points in each quarter and overall. The first downs picture looks pretty grim for them, as they are most average in obtaining passing first downs, and on the flip side they are most average in allowing rushing first downs. Drilling down into the rushing stats should make them even more worried, as they allow fewer plays than average, yet more yards and touchdowns. Offensively, they are pretty average in this area. In the passing game, they are extremely average in every statistic on both sides of the ball. As far as conversions go, they attempt more 3rd and 4th down conversions than average, and convert at a lower clip. Conversely, teams do not attempt many conversions against them, but convert at a better clip. That looks like a team that's going to struggle to kick us off the field. That said, they have controlled the clock decently this year, despite running more plays than average. Opponents run fewer plays against them but at a better YPP.
For

Against

Projections
Scoring
This analysis certainly makes the current point spread seem generous to TCU. The 75% and 90% confidence ranges went negative, and I truncated to zero for simplicity. My gut feel is we outscore them something like 17-10 in the first half, then 21-7 in the second half.

First Downs
Unsurprisingly, our balance here leans more towards rushing, theirs towards passing. Probably the most notable outcome of this analysis is they seem likely to get a couple first downs on penalty. Hopefully we don't sell out for punt blocks...

Yards
Not much to say here, other than how hilariously tight our projection is on passing yards. Note the sack column is yards allowed. I would be very surprised if they hold us under 200 yards rushing, though this analysis is most affected by the absence of Corum (*cries*). Will they crack 100 rushing yards against us?

Rushing
We are unsurprisingly more likely to lean on our run game than they are, and will almost certainly run more plays at a better clip.

Passing
Incredibly tight window on how many passes TCU will complete, with our relative analysis expecting 20.8 plus/minus 0.2, and theirs expecting 18.5 plus/minus 0.1. Midpoint analysis here suggests a very high probability of between 19 and 20 passes complete, with the only question being how many attempts it takes to get there. It is also fairly unlikely there will be any interceptions in this game. We are almost certain to get a few sacks though, whereas it looks like more of a crapshoot whether or not they get to JJ.

Conversions
Not sure how much to take away from this analysis. Thought about removing it but leaving for completeness.

Control
I was surprised the TOP projections are so close, with neither team expecting a differential of more than a few minutes. The expectation here is they will run more plays than we do at a lower efficiency. I assume a lot of the variance in our YPP comes down to how explosive we our, with our ball control offense driving the high floor.

Mistakes
If either team throws a pick, it is a bit more likely to be TCU. It is extremely unlikely either team loses a fumble, with TCU having a slight edge in ball security. They are (oddly) more likely to keep the pocket clean, yet also more likely to give up more than one sack. Conversely, we are more likely to avoid giving up a first down via penalty, but also more likely to give up multiple.

Scoring
The probability distributions got a little silly for rushing touchdowns, with ours showing a 3% chance of 6+ rushing TD. I calculated the probabilities up to 10 scores in each category, then punched that in to calculate expected points. This analytical lens is even more favorable than looking at score by quarter. That said, while I more strongly expect a score like 38-17, I wouldn't be particularly surprised to see our offense do better than that. Based on what I've seen so far, I will be a bit surprised if they crack 20.

December 23rd, 2022 at 11:23 AM ^
I will gladly take this outcome. Go blue!!
December 23rd, 2022 at 1:28 PM ^
But which team hits harder and pukes more in practice? I'll go with them.
December 23rd, 2022 at 4:49 PM ^
Of course you puke more when your drunk. Right, Scott?
December 23rd, 2022 at 11:24 AM ^
Man you have way too much time on your hands
December 23rd, 2022 at 11:26 AM ^
It's been a few weeks in process.
December 24th, 2022 at 2:06 AM ^
Just came over to post that every time I see your screen name, I picture Schembechler on a cheesy '80s local tv ad peddling Bo Glue with the tagline "It's Tough As Nails!", delivered with that gritty Bo snarl
(also ended up reading the analysis and was impressive and insightful!!)
December 23rd, 2022 at 11:43 AM ^
I think this analysis would be more impactful if you could cross-reference it with color of opponents jerseys as well as phylum, species, and class of opponent mascot. Can you get it to us by noon?
Kidding aside, I think the numbers give objective value to the idea that 8 1/2 point spread or 7 1/2 points is too few. Hopefully it’ll be 10 or 20 points to few.
December 23rd, 2022 at 12:17 PM ^
Yeah exactly. The spread seems pretty low based on the digging I've done. If I were the type of person to bet on Michigan sports, I would bet on us to cover.
December 23rd, 2022 at 12:31 PM ^
Yeoman's work. Much appreciated.
December 23rd, 2022 at 1:00 PM ^
I like to equate the Texas and Illinois games but this analysis shows them as not the same thing at all. Thanks for taking the time here.
December 23rd, 2022 at 1:22 PM ^
Yeah we basically did better than average in every stat except Q2 points and (sigh) fumbles on offense vs Illinois. On the flip side, Texas defense did better than they usually do in most stats.
December 23rd, 2022 at 2:23 PM ^
SP+ Says Michigan 32 - TCU 23.
Vegas says Michigan 33 - TCU 25.5
FPI says Michigan 66.5%
I'll go Michigan 38 - TCU 24
December 23rd, 2022 at 2:45 PM ^
Very positive and exciting hello post -- until the part where we lost interest in the next Braylon Edwards (c:
December 23rd, 2022 at 3:08 PM ^
*begins reading and decides it will take a lot of effort just to process this all*
[imagine how long it took to put together, then!]
*looks for conclusions*:
The numbers say 38–17 (17–10 first half, 21–7 second half), but OP thinks we score more than that so probably like 45–17.
Since there are many, many numbers; and, since OP is the one who put them together, I choose to believe 45–17.
Looks like a good score to me!
December 23rd, 2022 at 3:53 PM ^
Agreed, it's a lot to process. After putting the analysis together I definitely contemplated not even posting it, in part because of that. The other part being, of course, the effort involved in writing it all up. Hopefully that writing helps get a little more out of it than if it were just numbers.
December 23rd, 2022 at 5:13 PM ^
I project us putting the hypnotoad in a blender.
December 23rd, 2022 at 5:55 PM ^
vlady, speak it into existence...

December 25th, 2022 at 3:04 PM ^
With all respect, I think it will be more like the famous global warming frog in a pot of boiling water. The frog doesn't notice that the water is heating up, but suddenly it's being boiled alive.
December 23rd, 2022 at 6:34 PM ^
So you predict Michigan will win?
December 23rd, 2022 at 7:43 PM ^
And cover the spread.
December 23rd, 2022 at 7:03 PM ^
Tl;dr 43-18, favor of the good guys. Go Blue!
December 23rd, 2022 at 8:42 PM ^
Are you sure you’re not an actuary? Nice work!! I thought I overdid watching the full TCU Texas game. After watching that game I see TCU as a less talented but harder working PSU and predict same score 41-17.
December 24th, 2022 at 9:56 PM ^
Speaking as an actuary myself, this is impressive. Good shit Jed!
December 24th, 2022 at 11:02 AM ^
Phenomenal. My nonStatistical analysis estimate is 42-17. I must be a genius to do that in my head.
December 24th, 2022 at 2:06 PM ^
I think TCU will get a few more big plays on our defense. I could see us trailing 20-17 at the half. But 2nd half dominance will kick in and we will score 31 additional points in the 2nd. I could see a Michigan 51 - TCU 31 type game.
December 25th, 2022 at 1:01 PM ^
So you are saying with a 7.5 point spread we should take Michigan and with a 58.5 total points we should take the over….
Good to know.
December 25th, 2022 at 4:57 PM ^
Well the bottom of the 50% confidence interval for scoring is about 44 points so I wouldn't feel as good about the over.
December 25th, 2022 at 6:07 PM ^
As a guy who did data analytics for a living:

December 26th, 2022 at 12:39 AM ^
As a betting man, I appreciate this analysis. The projected score of 38-17 would be an easy cover for Michigan -7.5. The over/under is murky and will likely stay away from that bet. BTW, this is exactly what I would have done if I hadn't read this nice diary. But I do appreciate the additional confidence from a numbers guy.
December 26th, 2022 at 10:57 AM ^
Do you do taxes?
Comments