Do yards per carry increase with experience?

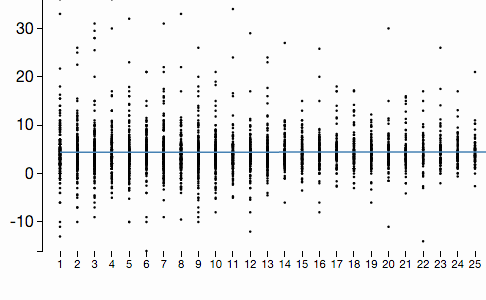
In the comments of an earlier diary post Ohiowild asked if MIchigan rushers showed an upward trend in yards per carry as they gain experience. I used the same top 200 rushers history to plot yards per carry vs. games played and then ran a regression so see if there was any indication of an upward trend.
The verdict: not so much.
[EDIT] I made some changes to the chart based on the comments.
How do we define experience? The data I have provides average yards per carry for each game in which the rusher has at least one attempt, so I have to define experience within that constraint. The Maizer pointed out right away that there were some big outliers and Nogit suggested filtering out games with only a few carries. So I arbitrarily filtered out any game with 5 or fewer attempts. Therefore, for this analysis I've defined a significant-experience game as one in which the rusher has more than 5 attempts.
For each player the chart plots the series of average yards per carry for each significant-experience game. So if a player had 30 significant-experience games in their career there would be 30 dots plotted at tick mark 1 through 30 on the x-axis.
Click here or on the snapshot below to see the full graph.
January 29th, 2016 at 1:24 PM ^
Whoa, who is the guy with almost 40 yards per carry after 36 games? I'm guessing he had like 2 carries in those 36 games? But then he maybe wouldn't be a top 200 rusher.
This might be interesting with ypc vs. total carries, also.
January 29th, 2016 at 2:19 PM ^
Each point is yards per carry in that game only for that individual player.
You got it. For the vast majority of instances where someone had 20+ yards per carry in a game, they only had 1 attempt. I could filter those out but I doubt it would change the results significantly.
January 29th, 2016 at 3:36 PM ^
January 29th, 2016 at 1:36 PM ^
Question for the next case study: Any correlation study on OL experience & YPC. I would have guessed that that has a larger effect on YPC than RB exeperience (which looks to be near nil).
January 29th, 2016 at 1:43 PM ^
indicated that yards per carry increase with longer runs.
January 29th, 2016 at 2:31 PM ^
Did they determine if it was correlation or causation?
January 29th, 2016 at 2:51 PM ^
The bama study answered this question with "yes"
January 29th, 2016 at 3:24 PM ^
that the equation: [yards gained / carries] increases if you increase the numerator relative to the denominator....this does not sound insightful. Longer runs > shorter runs. Genius!
January 29th, 2016 at 3:08 PM ^
January 29th, 2016 at 3:25 PM ^
I filtered out games with less than 5 attempts. I also added the slope and intercept of the regression line. After 30 games with 6 or more carries the regression predicts a runner improving from 4.3 to 4.8 yards per carry.
January 29th, 2016 at 3:34 PM ^
Graphs with unlabeled axes are horrible.
Graphs with misleading data are equally horrible. This doesnt graph experience affecting ypc, it graphs people who have played more games vs people who have played fewer games.
January 29th, 2016 at 3:49 PM ^
I've added a label to the x axis.
I'm not sure I get your second point. A dot plotted above the 30 tick on the x axis indicates a player who has played 30 games in which they have rushed more than 5 times (in each game). It's at least an indicator of experience running but maybe total attempts is better.
Are you suggesting a comparison of total rushes over time and yards per carry? I could give that a try. I appreciate the critique. And suggestions for making something more useful, and not misleading, are welcome.
January 29th, 2016 at 6:29 PM ^
I would actually compare yards for the carry vs nth time carrying the ball. So everyone's 1rst running attempt average ypc, then everyone's 2nd running attempt average ypc, etc. This will let us know if the rushes are averaging more ypc on the 100th attempt vs their 1rst attempt, and how their average ypc increases (or decreases) over time.
January 29th, 2016 at 6:43 PM ^
Unfortunately I don't have attempt by attempt data for each rusher. Only game by game. So the data has Net Yards, Total Attempts, Yards Per Attempt Average for the game. So I might be able to approximate by summing career net yards at the end of each game, and then getting a running average career yards per attempt at the end of each game. I'll look at the data and think about what I could do. I agree that would be interesting.
January 29th, 2016 at 4:19 PM ^
YPC is moreso an OL measure than a RB measure. A QB and his WRs and the overall offensive scheme may have as much to do with it as a RB. RBs are 1 of 11
If you look around you will see more correlation by year/OL/Offense (e.g., Fitz Toussaint in 2010 vs 2012) than you will by individual back. Most of the individual back stuff is explained by context (opponent difficulty, down and distance, etc.)
January 29th, 2016 at 7:19 PM ^
One of the most interesting questions looked at with stastical analysis done on this site.
January 30th, 2016 at 8:51 AM ^
You need to at least account for strength of schedule before you can say anything here.
Comments