mid-week metrics
We all know it matters. Otherwise there wouldn’t be four major recruiting sites, countless team-specific recruiting blogs and grown men tweeting and facebooking 17 year old high school males, and breathlessly refreshing message boards for the next 14 days.
The question I want to answer is how much does it matter, and where do the numbers play out the most? How much of team success can be predicted based on recruiting profile of the present roster (not the JUCO-stuffed 38 member SEC class that the majority never shows)? Do recruiting services do a better job of predicting offense or defense? Which is more likely to win you conference and national championships, the 5 star running back or the 5 star linebacker?
Methodology
I have created a complimentary recruiting database that links into my PBP database. For a source I picked Rivals because I wanted to keep it relatively straightforward and they have a full 10-year history online. I only looked at the players who were ranked at their position. Each year that is about 1,000 players and virtually every signee from a major program. Anyone not ranked for their position was omitted. I only have comprehensive rosters for all teams for the last three years, so for that time period I did my best to link the two DBs together. I am sure there are a few that I am missing but I think I got all the Dee Harts linked up with Demetrius Harts and all the other weird things that happen to a recruit's name between recruitment and the official roster.
Each recruit is given an initial value. The value is roughly
[Percentile within position] * [# of stars] ^ 2
So a 5 star #1 at his position recruit is worth about 25 points and a 50th percentile 3 star would be worth 4.5 pts. The initial value is then adjusted based on how long the player has been in the program.
The recruits are then matched up with the final rosters. Players are only counted if they are still on the roster. So any players that have transferred, left school or gone to the NFL are excluded from the totals. The only major gap is transfers. For ones I knew of right away like Cam Newton or Ryan Mallet, they only count at their final school. Most other transfers will only show up at the original school for their time there and then disappear from the grid. Players are then given a “bonus” multiplier based on their experience. Players' initial values are doubled from their first year to their second year and tripled for every year after that.
That’s a lot fewer words than hours put in but in a nutshell, that’s the background for what I will show you below. The magnitude of the points isn’t relevant, all you need to know is the more points the better.
Answer Your Question Already
When you start talking to yourself within an article on mgoblog, there is only one appropriate response, CHART
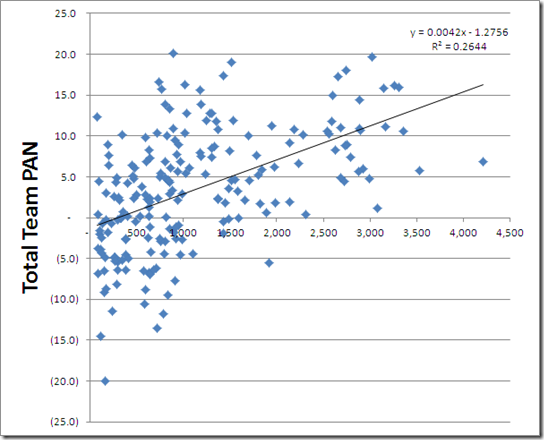
Lot’s of variation within the numbers but definitely a strong correlation between recruiting points and team PAN [ed: points above normal, the Mathlete's SOS- and situation-adjusted stat]. For all the charts I put up the data will be BCS schools from 2009-2011. Recruits prior to 2009 will be included, but only the actual seasons of play from 2009 on.
There have been some really good seasons from teams with <1,000 pts like Oklahoma St this past season (896). There have also been some mediocre season from teams with 3,000+ points like Texas in 2010 (3,082 pts). But all in all more recruits is better, but we already knew that. So let’s dig a little deeper and see if recruiting rankings mean more for offense or defense and if any position groups are better indicators than others.
Who To Trust, Offense or Defense
Moving to specifics can become a bit more of a challenge. To ease that, I counted every recruit in the position they play, not the position that they are recruited for. They keep the same point total they would at the original position, it just counts in a different bucket. Whether its a WR moving to DB or an ATH finding a home, the points are set based on the initial group ranking, but they are allocated based on the roster position. On to the offense.
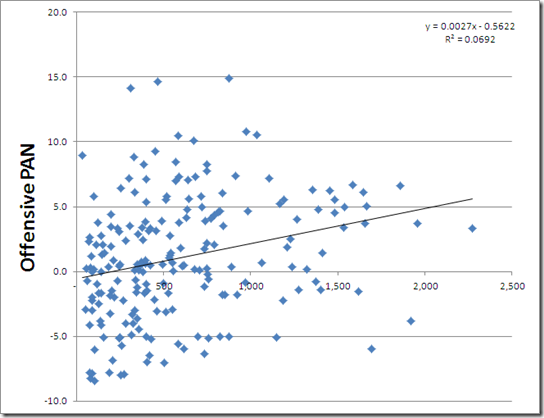
The correlation is still there, but it is much weaker for the offense as opposed to the team as a whole. In fact, most of the best offensive seasons were accomplished with relatively average recruiting talent. The ultimate loaded team, 2009 USC, only managed a 3.3 on offense with 10% pts more than any other team I have measured. Teams like the latest incarnations of Michigan and Oregon were able to achieve double digit offensive PAN without elite offensive recruiting classes.
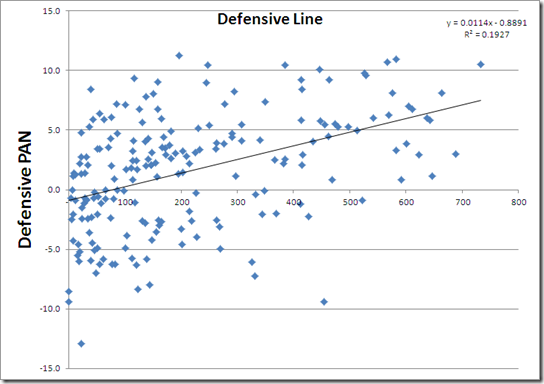
Defensive recruiting is much more correlated with defensive success than offensive. The slope is nearly double and the R-Squared is much greater as well. There are still exceptions like 2009 Florida St who was almost –10 PAN despite over 1,000 defensive recruiting points. There is still success on the lower range but overall there are fewer failures at the top and less success at the bottom of defensive recruiting rankings.
Based on this data, system, player development and finding diamonds in the rough are more prevalent on offense than defense. On defense there is some variation but for the most part you are who you recruit. Unless you hire Greg Robinson and even your Never Forget roster still has 853 points to “earn” a –7 on the season.
The Best Position To Be In
Since the defense as a whole proved to be the most predictive, let’s look there first.
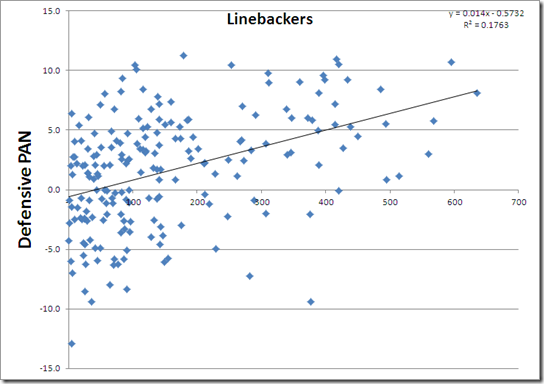
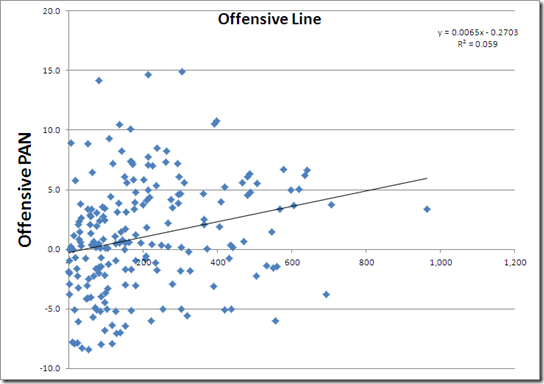
Being a good defense is all about your weakest link and based on that philosophy, you shouldn’t be surprised to see all positions play out relatively equal. None of the position groups is significantly better or worse than another at predicting defensive success.
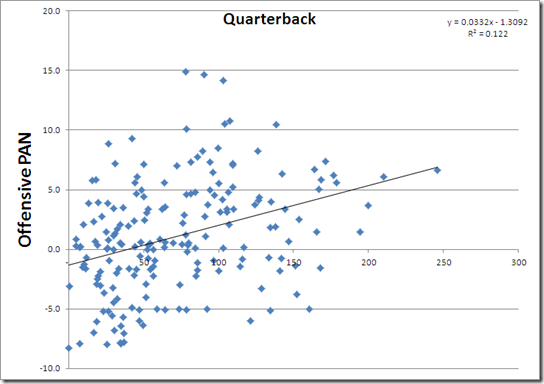
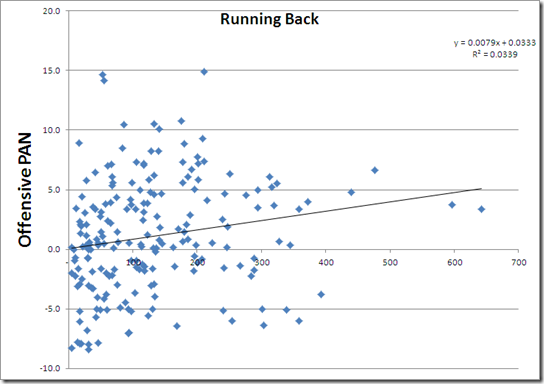
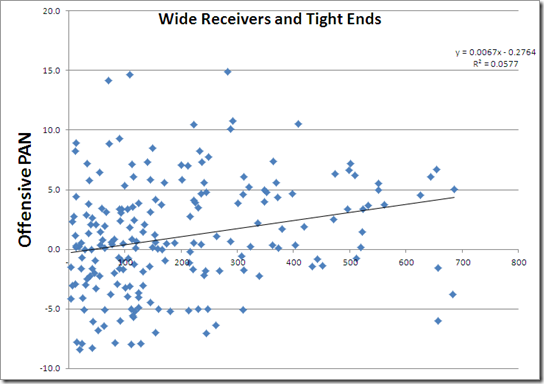
Offense is where it really gets muddled. O-Line, tight ends and receivers all are moderate correlations between recruiting and offensive success and running backs (as I’ve stated elsewhere) are the most overrated position in football. Quarterback is far and away the highest correlation to offensive success of any position. Even with that QB, is still below all of the defensive positions when it comes to future success on that side of the ball.
Conference Variation
How recruiting matches up with success varies greatly by conference. Rather than throw up six more charts, I just put the R^2 values in a table:
| Conf | R^2 |
|---|---|
| ACC | 0.50 |
| Big East | 0.07 |
| Big Ten | 0.33 |
| Big 12 | 0.22 |
| PAC 12 | 0.06 |
| SEC | 0.43 |
Recruiting has virtually no correlation to success over the last three years in the Big East and the PAC 12 but for the other four conferences it's anywhere from a little (Big 12, land of Red River and everyone else) to a lot (the ACC and the SEC).
The Big Ten is in the middle; Ohio St has dominated at the top of both recruiting and success but Michigan’s underachievement and Wisconsin and Nebraska having strong seasons without top tier recruiting classes have thrown in enough variance to disrupt the correlation.
Your 5 Star Takeaway
Recruiting rankings have a huge correlation to future team success, especially on defense. Great teams can come from average talent, but more talent typically means more success. On defense it is virtually impossible to build an elite defense without elite recruits, and its equally true across all defensive positions. On offense dreams of 5 star skill position players are fun, but coaching, player development, system and luck play a much bigger role in future success than they do on defense. With top 20 and higher recruits at nearly every position on defense, Michigan is poised for a very strong future if they can keep the talent around.
Back at the real job today after a great two weeks of football, ready to start cheering for the team I love, not just the one I have money on like the uniforms better.
Virginia Tech Preview
PAN, National Rank (leader)
Rush Offense
Michigan: +5, 4th (Oregon)
vs VT: +1, 40th
Pass Offense
Michigan: +3, 29th (Baylor)
vs VT: +3, 22nd
Rush Defense
Michigan: +1, 46th (Alabama)
vs VT: +2, 28th
Pass Defense
Michigan: +1, 39th (Texas)
vs. VT: +2, 31st
Special Teams
Michigan: +0, 60th
vs VT: –0, 73rd
A pretty close match-up in all areas except when Michigan is rushing the ball. That’s likely the best avenue for Michigan to leverage. With arrests, suspensions and a late season Michigan surge, special teams could be an opening as well. This should be a close one but this game is Michigan’s to lose, 31-28 Michigan.
Ron Zook Memorial Dumb Punt of the Bowl Season
Haven’t had a chance to review all of the bowl games, but Wisconsin’s first quarter punt has to be the top contender. Two potent offenses, touchdowns on the first three possessions and the Badgers face 4th and 3 at the Oregon 38. Despite the best scrambling QB in college football and an offense geared to pound the ball on the ground against a defense that hadn’t stopped them in their first two drives, Wisconsin played field position. Against Oregon. Two plays later the Black Mamba is flashing chrome 91 yards for a TD in a 7 point Ducks win. Wisconsin is 22/30 on 3rd and 2-4 yards on the season in competitive situations.
Richt/Shaw/NFL Coaching Conservatory
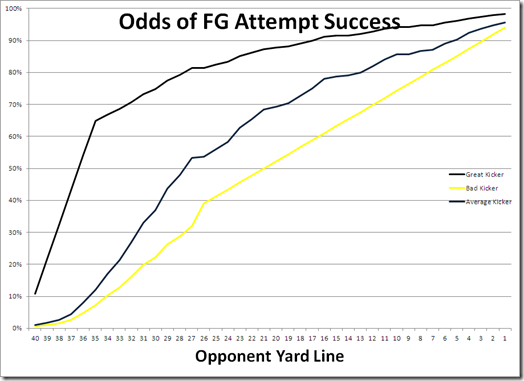
This was just brutal watching teams play for field goals. It’s not a great strategy in the NFL where nearly all the kickers are money inside of 40 and pretty good from 40-55. College kickers, even the good ones, not so much. Here is the table I use to estimate kicker success. From the 25 even a top-notch college kicker is going to miss 20%, an average one is going to miss nearly half the time. Getting a single first down moves the odds significantly.
One other update to the Game Theory Manifesto that I tweeted about during the MSU/Georgia trying not to lose-fest, if you are in the lead and the other team has time-outs left, don’t run up the middle on third down unless you think that’s your best shot to get the first down. The clock is going to stop after your play no matter what. One extra timeout in your opponent’s pocket has very little chance of deciding the game. A first down in most cases will end or nearly end the game. Don’t be careless but if you have a dependable QB like Aaron Murray, throw the ball and give yourself a chance to end the game.
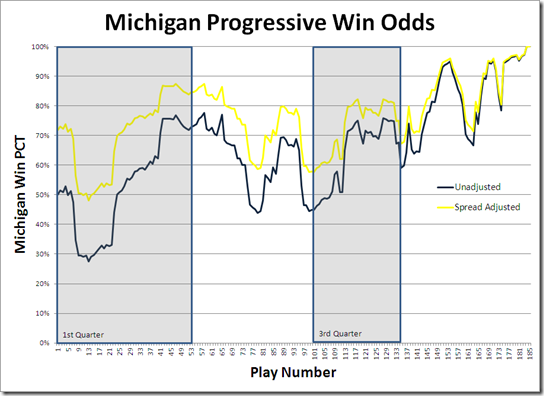
It’s not quite the fourth quarter against Notre Dame, but Saturday had as many ups and downs on the Win Chart as any we’ve seen this year.
We’ll go with 5 plays each this week to mark the occasion.
Top Plays:
1. Play 112, 14.2%, Robinson to Odoms on 3rd and 11 to give Michigan the lead back for good while the OL gave Denard all day.
2. Play 163, 11.2%, Robinson to Dileo for 28 yards on Michigan’s final drive.
3. Play 22, 11.1%, Robinson runs for 41 yards to tie it up early.
4. Play 165, 9.5%, Robinson runs for 14 yards to keep the clock moving and the drive going late.
5. Play 137, 9.3%, the defense gets in the mix, stopping Miller on 3rd and Goal from the 2, leading to the FG instead of a touchdown.
Bottom Plays:
1. Play 7, –12.8%, Miller goes deep for the first score of the game.
2. Play 95, –12.0%, Miller goes deep a second time to give Ohio a halftime lead.
3. Play 172, –8.8%, Steve Watson’s personal foul pushed 3rd and Goal from difficult to impossible and increases the degree of difficulty on an impending field goal.
4. Play 134, –8.6%, Miller goes for 23 yards to give Ohio 1st and Goal at the 5 late in the third quarter.
5. Play 74, –7.1%, Miller uses my favorite NCAA Football play with an athletic QB, the wrong way speed option for a TD.
Ohio Game Scores
Rushing: +12, tops in Big Ten play and behind only SD St and E Michigan on the year
Passing: +11, second only to Northwestern on the season
Rush Defense: –9, worst score of the season
Pass Defense: –7, only Notre Dame was worse
Special Teams: +3, the late field goal pushed this to the top of the list for this year
Denard: As I tweeted earlier this week, Denard had the 5th best game of any QB this year at +24. It was both his best passing (+13) and best rushing (+11) game of the season. It was only the 7th +10 rushing performance by any QB this year and the first to pair it with a passing number higher then +3!
Toussaint: +1, a solid but not spectacular day.
Miller: Braxton Miller is going to be a force. His +15 (+6/+9) was his best game of the year by 6 points. His three games have been his three best. Had Ohio gone with him from the start Ohio is probably has at least 8 wins now.
Saturday’s +23 was the 9th best opponent adjusted offensive game of the year for any team and the best game in BCS conference play.
Fired Coach Dumb Punt of the Week
Several good candidates this week. Clemson punting from the 35 late in the third trailing by two touchdowns. Ohio punting from the 36 trailing by 6 in the third. This week’s award goes to the $8 Million Dollar Man Mike Sherman who punted from the 41 twice in the second half, going on to blow their 42nd 6th lead of the season and losing the final chapter of the Texas-Texas A&M rivalry on a last second field goal.
Big Ten Projection Recap
On Aug 26th I posted projections for the season, it’s now time to pay the piper and see how they PAN‘d out.
Team: Pred W, Pred B1G W
Illinois: 8.0, 4.5
Indiana: 2.9, 0.6
Iowa: 7.8, 4.6
Michigan: 8.0, 4.8
Michigan St: 8.0, 4.7
Minnesota: 3.9, 1.2
Nebraska: 10.1, 6.1
Northwestern: 3.9, 1.7
Ohio: 9.3, 5.8
Penn St: 8.5, 5.2
Purdue: 5.7, 2.7
Wisconsin: 10.3, 6.3
That’s an average error of 1.4 games/team in total and 1.3 in conference play. Ohio was clearly my biggest miss, missing both numbers by about 3 games. Wisconsin was dead on and Iowa, Minnesota, Penn St and Purdue were all pretty close. I had the top and bottom of the Woody division correctly ranked but the middle was a mess. For the Bo division I swapped Nebraska and Sparty both nailed the other 4.
Nationally, picking conference winners went decently. Virginia Tech is favored in the ACC title game, along with other picks of mine like Wisconsin and Oregon. West Virginia is right in the middle of the Big East mess. If Alabama could make a field goal they would be playing for the SEC title and Oklahoma is playing for the Big XII’s BCS berth at bedlam.
In the smaller conferences, Tulsa, Toledo, Boise and Nevada all had shots but fell just short of championships while Troy wasn’t even close in the Sun Belt.
Advanced Metrics All-B1G
Offensive players are listed as PAN (per game)/WPA (total). OL is excluded because I have no stats specific to players. TE are evaluated solely on receiving. Defensive players are listed as Plays/Value (count and magnitude of plays made negative to the offense). Kickers and punters are cumulative for the season.
This is not meant to be absolute, but it is a ranking based solely on the advanced metrics, no judgment calls on my part.
First Team
QB
Russell Wilson, Wisconsin +13/+3.4
RB
Montee Ball, Wisconsin +5/+1.2 & Marcus Coker, Iowa +1/+0.7
TE
Drake Dunsmore, Northwestern +3/+0.8
WR
Jeremy Ebert, Northwestern +8/+2.1 & Marvin McNutt, Iowa +7/+1.3 & AJ Jenkins, Illinois +7/+1.3
DE
Broderick Binns, Iowa 47/32 & Whitney Mercilus, Illinois 35/36
DT
Devon Still, Penn St 45/28 & Johnathan Hankins, Ohio 50/21
LB
Jonathan Brown, Illinois 75/41 & Lavonte David, Nebraska 59/29 & Gerald Hodges, Penn St 52/28
CB
Josh Johnson, Purdue 33/21 & Bradley Roby, Ohio 21/27
Safety
Brian Peters, Northwestern 32/28 & Drew Astorino, Penn St 34/18
K
Dan Conroy, Michigan St +12.4
P
Ben Buchanan, Ohio +10
Second Team
QB
Denard Robinson, Michigan +7/+3.5
RB
Fitzgerald Toussaint, Michigan +1/+.4 & Rex Burkhead, Nebraska +0/+.3
TE
Jacob Pedersen, Wisconsin +2/+0.3
WR
BJ Cunningham, Michigan St +7/+1.1 & Nick Toon, Wisconsin +6/+1.0 & Da’Jon McKnight, Minnesota +4/+0.8
DE
John Simon, Ohio 40/25 & Michael Buchanan, Illinois 38/18
DT
Mike Daniels, Iowa 40/22 & Akeem Spence, Illinois 40/18
LB
David Nwabuisi, Northwestern 51/21 & Ian Thomas, Illinois 47/20 & Will Compton, Nebraska 49/18
CB
Tavon Wilson, Illinois 28/17 & Ibraheim Campbell, Northwestern 25/17
Safety
Jordan Kovacs, Michigan 17/27 & CJ Barnett, Ohio 25/18
K
Brett Maher, Nebraska +11.8
P
Cody Webster, Purdue +8
Ryan van Bergen, Mike Martin and Kenny Demens all narrowly missed spots on the second team defense.
Upcoming Schedule
Don’t know if articles will be coming weekly, but I have a number of articles and ideas in the hopper for the pre and post-bowl season.
A bowl game preview
The promised Game Theory Manifesto
A 4th down redux, a more detailed look at fourth down decision making with an added tool of offensive and defensive strength sliders for dynamic decision making.
A critique of success rates and the concept of “staying ahead of the chains”
A semi-related post on why I think the running back position is overrated
A more detailed looks at the EV and WPA implications tied to UFR.
EV and WPA by coaches and if I can find a good source of history, coordinators, as well.
Some recruiting themed posts around signing day on the back of a massive recruiting database I am building on the back of my play by play database. I think there is a lot of potential here, just don’t know if I can pull it off.
Any user submitted ideas that are sure to be better than what I have listed so far.


28