What’s a 5 Star Really Worth: Predicting Future Team Success Off of Recruiting Rankings
We all know it matters. Otherwise there wouldn’t be four major recruiting sites, countless team-specific recruiting blogs and grown men tweeting and facebooking 17 year old high school males, and breathlessly refreshing message boards for the next 14 days.
The question I want to answer is how much does it matter, and where do the numbers play out the most? How much of team success can be predicted based on recruiting profile of the present roster (not the JUCO-stuffed 38 member SEC class that the majority never shows)? Do recruiting services do a better job of predicting offense or defense? Which is more likely to win you conference and national championships, the 5 star running back or the 5 star linebacker?
Methodology
I have created a complimentary recruiting database that links into my PBP database. For a source I picked Rivals because I wanted to keep it relatively straightforward and they have a full 10-year history online. I only looked at the players who were ranked at their position. Each year that is about 1,000 players and virtually every signee from a major program. Anyone not ranked for their position was omitted. I only have comprehensive rosters for all teams for the last three years, so for that time period I did my best to link the two DBs together. I am sure there are a few that I am missing but I think I got all the Dee Harts linked up with Demetrius Harts and all the other weird things that happen to a recruit's name between recruitment and the official roster.
Each recruit is given an initial value. The value is roughly
[Percentile within position] * [# of stars] ^ 2
So a 5 star #1 at his position recruit is worth about 25 points and a 50th percentile 3 star would be worth 4.5 pts. The initial value is then adjusted based on how long the player has been in the program.
The recruits are then matched up with the final rosters. Players are only counted if they are still on the roster. So any players that have transferred, left school or gone to the NFL are excluded from the totals. The only major gap is transfers. For ones I knew of right away like Cam Newton or Ryan Mallet, they only count at their final school. Most other transfers will only show up at the original school for their time there and then disappear from the grid. Players are then given a “bonus” multiplier based on their experience. Players' initial values are doubled from their first year to their second year and tripled for every year after that.
That’s a lot fewer words than hours put in but in a nutshell, that’s the background for what I will show you below. The magnitude of the points isn’t relevant, all you need to know is the more points the better.
Answer Your Question Already
When you start talking to yourself within an article on mgoblog, there is only one appropriate response, CHART
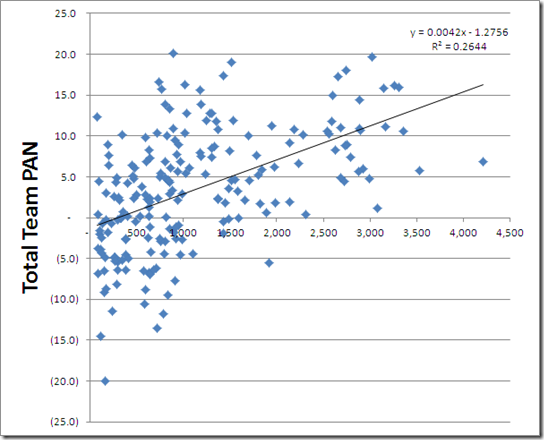
Lot’s of variation within the numbers but definitely a strong correlation between recruiting points and team PAN [ed: points above normal, the Mathlete's SOS- and situation-adjusted stat]. For all the charts I put up the data will be BCS schools from 2009-2011. Recruits prior to 2009 will be included, but only the actual seasons of play from 2009 on.
There have been some really good seasons from teams with <1,000 pts like Oklahoma St this past season (896). There have also been some mediocre season from teams with 3,000+ points like Texas in 2010 (3,082 pts). But all in all more recruits is better, but we already knew that. So let’s dig a little deeper and see if recruiting rankings mean more for offense or defense and if any position groups are better indicators than others.
Who To Trust, Offense or Defense
Moving to specifics can become a bit more of a challenge. To ease that, I counted every recruit in the position they play, not the position that they are recruited for. They keep the same point total they would at the original position, it just counts in a different bucket. Whether its a WR moving to DB or an ATH finding a home, the points are set based on the initial group ranking, but they are allocated based on the roster position. On to the offense.
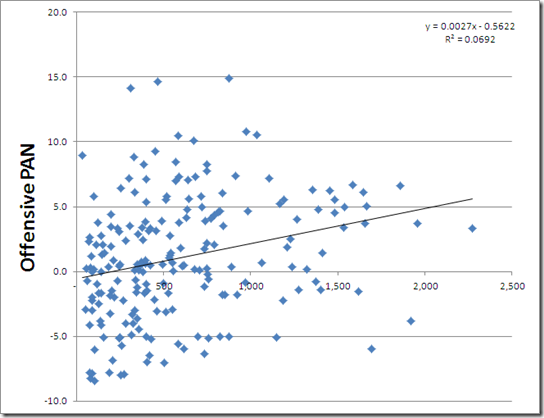
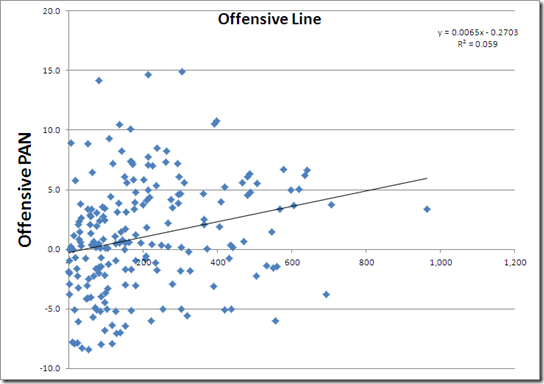
The correlation is still there, but it is much weaker for the offense as opposed to the team as a whole. In fact, most of the best offensive seasons were accomplished with relatively average recruiting talent. The ultimate loaded team, 2009 USC, only managed a 3.3 on offense with 10% pts more than any other team I have measured. Teams like the latest incarnations of Michigan and Oregon were able to achieve double digit offensive PAN without elite offensive recruiting classes.
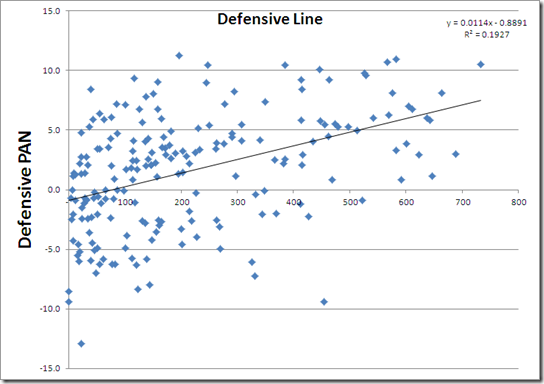
Defensive recruiting is much more correlated with defensive success than offensive. The slope is nearly double and the R-Squared is much greater as well. There are still exceptions like 2009 Florida St who was almost –10 PAN despite over 1,000 defensive recruiting points. There is still success on the lower range but overall there are fewer failures at the top and less success at the bottom of defensive recruiting rankings.
Based on this data, system, player development and finding diamonds in the rough are more prevalent on offense than defense. On defense there is some variation but for the most part you are who you recruit. Unless you hire Greg Robinson and even your Never Forget roster still has 853 points to “earn” a –7 on the season.
The Best Position To Be In
Since the defense as a whole proved to be the most predictive, let’s look there first.
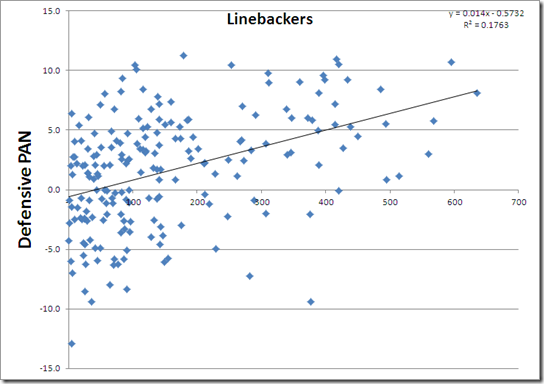
Being a good defense is all about your weakest link and based on that philosophy, you shouldn’t be surprised to see all positions play out relatively equal. None of the position groups is significantly better or worse than another at predicting defensive success.
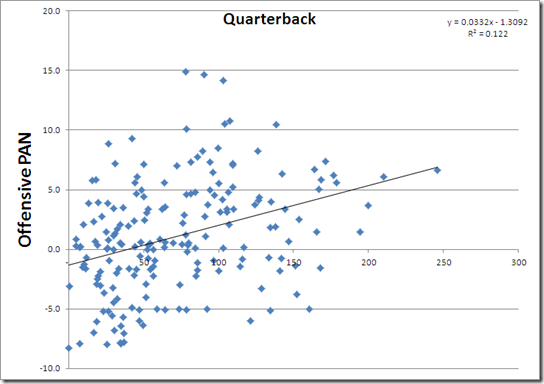
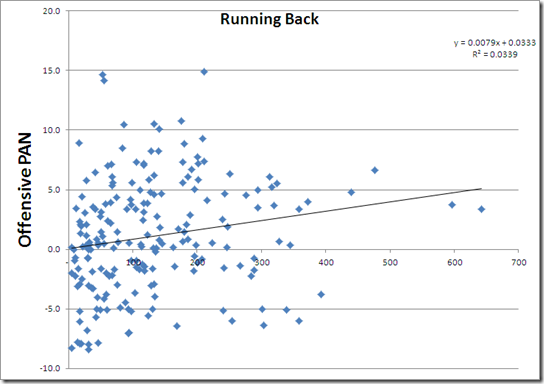
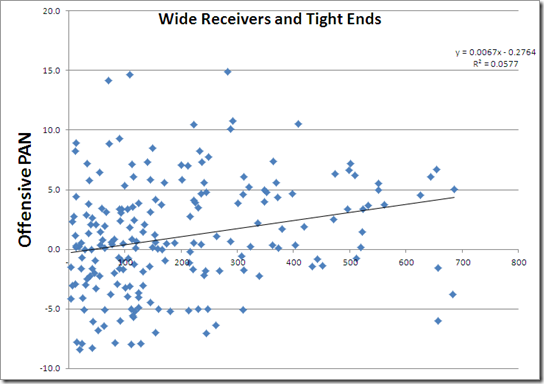
Offense is where it really gets muddled. O-Line, tight ends and receivers all are moderate correlations between recruiting and offensive success and running backs (as I’ve stated elsewhere) are the most overrated position in football. Quarterback is far and away the highest correlation to offensive success of any position. Even with that QB, is still below all of the defensive positions when it comes to future success on that side of the ball.
Conference Variation
How recruiting matches up with success varies greatly by conference. Rather than throw up six more charts, I just put the R^2 values in a table:
| Conf | R^2 |
|---|---|
| ACC | 0.50 |
| Big East | 0.07 |
| Big Ten | 0.33 |
| Big 12 | 0.22 |
| PAC 12 | 0.06 |
| SEC | 0.43 |
Recruiting has virtually no correlation to success over the last three years in the Big East and the PAC 12 but for the other four conferences it's anywhere from a little (Big 12, land of Red River and everyone else) to a lot (the ACC and the SEC).
The Big Ten is in the middle; Ohio St has dominated at the top of both recruiting and success but Michigan’s underachievement and Wisconsin and Nebraska having strong seasons without top tier recruiting classes have thrown in enough variance to disrupt the correlation.
Your 5 Star Takeaway
Recruiting rankings have a huge correlation to future team success, especially on defense. Great teams can come from average talent, but more talent typically means more success. On defense it is virtually impossible to build an elite defense without elite recruits, and its equally true across all defensive positions. On offense dreams of 5 star skill position players are fun, but coaching, player development, system and luck play a much bigger role in future success than they do on defense. With top 20 and higher recruits at nearly every position on defense, Michigan is poised for a very strong future if they can keep the talent around.
January 17th, 2012 at 9:54 AM ^
Does TRUE GRIT factor in to elite defenses? If so, Michigan would be off the charts.
Kovacs baby!
January 17th, 2012 at 11:50 AM ^
Fantastic info. Yes we do still seem to instill “Heart” along with the “Blue” inside.
Just wonder how ND falls in all this. Domers seem to get these awesome classes every year, loaded with 5* and just haven’t been able to do anything significant with them.
Not that I want them to, mind you. Just wonder if the data supported the “…where 5*’s go to die” hypothesis. 8)
January 17th, 2012 at 10:00 AM ^
One point not extensively discussed, is that quarterbacks have the highest correlation between recruiting ranking and collegiate success.
A few factors may contribute to this:
1) The QB will be filmed on every snap he plays, so it is a lot easier for scouts to evaluate QBs based on their total body of work.
2) QBs have a lot of measurables, because they generate more stats than any other position.
3) There are a lot of camps that focus on QB play specifically, so there are a lot of opportunities for them to be evaluated.
At the other end, you would expect offensive linemen to be tough to evaluate, because their position generates the fewest stats (as in: none).
But the rather weak correlation with wide receivers and running backs surprises me, and it's hard for me to put my finger on the reasons for it.
January 17th, 2012 at 11:18 AM ^
Quarterback is far and away the highest correlation to offensive success of any position. Even with that QB, is still below all of the defensive positions when it comes to future success on that side of the ball.
January 17th, 2012 at 3:15 PM ^
QB is at 0.03x and the D positions are at 0.01x.
January 18th, 2012 at 12:14 AM ^
It's not the highest correlation, as stated in the post. Furthermore...
1) Me thinks every player is filmed on every play. I don't think high school QB's receive the same individual camera attention afforded to elite NFL QB's (see; Brady, Tom (not to say that even TB has a camera situated only on him every snap (He doesn't.))).
2) QB "generated" stats are subject to more externalities than any other position, exposing them to the (dis)advantage of dramatic skewing (a poor vs. exceptional OL; having an elite receiver; particular coaching scheme, although every position is subject to this to a degree). Perhaps "QB logged stats" would be more accurate.
3) There are some stats available, though not many, but 2) indicates that individual stats may be (often are) a poor indicator of success. Fact of the matter, there are a bunch of guys with a bunch of specific knowledge who are paid a bunch of money to spend a bunch of time looking at a bunch of film and who have, thankfully, made it unnecessary for you to place your finger anywhere near reason.
So there..
January 17th, 2012 at 10:01 AM ^
As usual, this is both informative and well done. A well thought out argument is most persuasive when there are facts to back it up...you sir have given me that. Mad props.
January 17th, 2012 at 10:33 AM ^
And I know it's not fair to ask for more (free) content, but some other avenues for inquiry:
1. I know you've been collecting that coaching database. It seems like that should line up nicely with a look at which coaches most systematically under/overperform their recruiting rankings?
2. Adding a variable for offensive scheme would also be interesting. Yeah it's a bitch with 120 teams, but I think again you could open up a google docs spreadsheet and MGoBlog members would be happy to contribute data when they knew it. It would be very interesting to see if offensive recruiting ranking match up much better with pro style systems than they do with spread sets.
More generally, and this is something that could be gleaned from the data with no manual coding needed: do teams with higher pass/run ratios have lower correlations than vice versa? How about teams where the QB makes up a higher percentage of team rushing yards? Etc...
3. This isn't even an inquiry, but could we maybe see a list of the top 10 over and underperforming units in your study? You mention the Michigan/Oregon offenses, but I'd be curious to see the whole list.
Thanks.
January 17th, 2012 at 3:39 PM ^
This data is all great, but such a teaser.
I can't look at those scatters without going,
A. "hmm I wonder where Michigan/OSU/ND/Sparty's dots are in there?"
B. "hmm I wonder who that outlier is?"
January 17th, 2012 at 11:16 AM ^
i posbang you for excessive awesomeness.
i wonder if the low correlation btwn ranking and offensive output has to do with clever schemes. USC was tied up in a fairly conservative scheme. the who point of the spread was to shrink the advantage of a talent spread. in that vain, i agree with kmedved's second question - i bet spreads get the most use of their talent.
January 17th, 2012 at 11:18 AM ^
Mathlete, it seems you get more done with your free time than I do when I'm actually at work.
January 17th, 2012 at 11:32 AM ^
Brilliant work.
The spin on a study like this is always "see, stars do matter." As though in answer to the commonly-held belief that stars mean nothing. I think the opposite is true. Everyone hyperventilates over stars (to the point of begging analysts to add a star to a player you're already going to get (however good he is), just so you can see him on a web page with 4 or 5 stars next to his name and feel even better about things). And so I think the more interesting thing to note is the incredible variance in your charts -- notwithstanding the strong overall trend, which certainly must be acknowledged. As you say, coaching and player development matter a lot, and you are by no means doomed by mediocre talent (esp. on offense).
The stronger correlation on defense is very interesting and very persuasively presented. Again, great work.
January 17th, 2012 at 12:53 PM ^
many people do (ignorantly) proclaim "stars don't matter." So more data is better at refuting that, and this is another in several studies that prove that yes, it is worthwhile to be happy that your favorite team got a four star guy, variance notwithstanding. I do agree that people go way too far the other way, and your example is one way that they do. But just like with the stock market and other fields, the trend is what matters, not the outliers.
January 17th, 2012 at 11:32 AM ^
Great information and an amazing post!
January 17th, 2012 at 11:33 AM ^
This is pure awesomeness. Thanks so much!
One question: why don't you put more than one of these in a multivariate regression model? Great offensive recruiting classes are almost certain to go along with great defensive classes, so the bivariate plots you're giving us are almost certain to be textbook illustrations of omitted variable bias. Even if the correlation is reasonably strong between defensive stars and success, the regression coefficient on defense recruiting probably overstates the effect.
January 17th, 2012 at 11:37 AM ^
If you note the y-axis' the only time recruiting is compared against team success is on the overall team recruiting totals. Offense, defense and position recruiting are only compared against offense or defense success. I agree with your point that they are tied, but I am not comparing OL recruiting to team success, just offensive.
January 17th, 2012 at 11:42 AM ^
[triple post!]
January 17th, 2012 at 11:42 AM ^
[triple post + mathlete beat me to the correction!]
January 17th, 2012 at 11:41 AM ^
OK, you're regressing on defensive and offensive PAN, not total team. Ignore my previous comment.
January 17th, 2012 at 11:49 AM ^
This is interesting . . . and confirms my belief that, as a coach, I need to get my best athletes on the field to play defense. Athletes make plays on defense. Sometimes people get too caught up in talking about positions. If a kid is one of the 11 best athletes on the team, he needs to find a position on defense (unless he's the QB...in which case I might need to protect his health a little bit).
As you seem to indicate, offense is a little bit more about system and finding diamonds in the rough. There are plenty of good offensive players who aren't very big or very fast, especially receivers and running backs. But the good defensive players are usually either big or fast...and it helps if they've got a good head on their shoulders.
Anyway...good work, mathlete.
January 17th, 2012 at 11:56 AM ^
Did we win?
January 17th, 2012 at 12:13 PM ^
January 17th, 2012 at 12:14 PM ^
Let the drooling over our future defense begin. Pipkins at dt, Wilson at s, Richardson at cb, Ross/Bolden/RJS at lb. All these 4 stars should tear it up under Mattison and Hoke.
January 17th, 2012 at 12:16 PM ^
I really really enjoy reading these analyses that you put together!
I notice that you chose the Rivals database to use for your recruiting rankings, which makes a lot of sense since they have the most data available. I wonder if you could use your same methodologies and Scout/ESPN/247 databases (assuming information is available) to see how their rankings correlate with future success and thus provide another bullet point in the argument of which recruiting service has the most reliable rankings.
Obviously team success and individual success are not the same, and also you can only really work with the data that is available. But I think it would certainly be interesting, especially as more and more recruiting data becomes available.
January 17th, 2012 at 1:03 PM ^
Logically this seems to make perfect sense as well.
Its a lot easier to hide your weaknesses athletically when you can control where a play is going and forcing someone to react to you. On defense you can get away with being technique sloppy or imperfect if you're a phenomenol athlete. A lot of defense is reacting and physically overmatching your opponent. You can't really finesse an opponent on defense and have long term success.
January 17th, 2012 at 1:30 PM ^
I like the way you included percentile rank within position, which is a way to make a distinction between a high 4-star and low 4-star, etc.
This would probably be very labor-intensive, but it would be interesting to see what would happen if you controlled for collective number of games started prior to the season. For example, I would guess that Auburn's 2011 defense did very poorly compared to its recruiting rankings, but this should not have been too surprising given how little experience they had.
January 17th, 2012 at 3:22 PM ^
Look at the player's offer sheet and the depth of the player's position on the offering teams...
January 17th, 2012 at 5:20 PM ^
Alabama: oversigns like crazy, is loaded with 4- and 5- stars.
Alabama: has ridiculous awesome defense.
QED, you are right. Mathlete, you did it again!
More seriously, very nice numbers. I do wish I could look at them more myself though (but perhaps you don't want to share the database...?)


Comments