mathlete
[Ed.: Bump. This makes sense to me: Michigan should mostly dump special teams once it gets across midfield.]
As Brian highlighted in the UMass round-up, maybe forgoing the punt altogether might not be such a bad decision. He noted my earlier look at the the topic and I wanted to pull it back and revisit and refine some of the work.
I looked at the years 2004-2009 and only looked at the top 20 rated offenses for each year. This study assumes that Michigan’s offense this year will be at a top 20 caliber and provides a broad enough definition of greatness that there is a good sample size. I did not distinguish what type of offense (Texas Tech Air Raid vs Georgia Tech triple option vs spread and shred) was used to get into the top 20. I will detail more assumptions as they are applicable along the way. In place of fourth down conversion percentages I used third down conversion percentage since the data pool is much larger and covers a wider variety of opponent levels. Since the thought process on a third down and fourth downs are roughly the same in most all (for now, anyway) situations, it seems reasonable to use the third down numbers.
Time for a you know what…

Assumptions: Top 20 offense, average defense, average punt game, average field goal kicker.
Based on these assumptions, except for long yardage, the punter should grab a seat once the offense crosses midfield. On your own side of the field the decision still makes sense starting around the 30 for shorter yardage situations and becomes more viable for longer yardage as you cross further down the field. Field goals become practical with 4+ yards to gain and only from about the 5-25 yard lines.
There are two big advantages a potent offense has that make 4th down tries more logical. The first is that they have more to gain by success. With a limited number of drives in a given game, why give them away for free? The second is that they are more likely to make them. Good offenses are more likely to be in better position on fourth down and more likely to make it. Here is a chart of great offenses fourth down conversions compared with all offenses. The right hand column was the one used for the above chart.
| To Go | All Teams | Great Off |
| 1 | 72% | 74% |
| 2 | 57% | 60% |
| 3 | 51% | 54% |
| 4 | 47% | 50% |
| 5 | 42% | 45% |
| 6 | 38% | 41% |
| 7 | 35% | 37% |
| 8 | 32% | 34% |
| 9 | 30% | 32% |
| 10 | 27% | 30% |
It’s not a huge advantage on any one given down, but Top 20 offenses convert the same opportunities about 2-3 percentage points more often than the average offense. Note: the rate of conversion for great offenses was much higher in the original analysis and is part of the reason the chart isn’t quite as go for it as the original.
But we don’t have an average <blank>
<blank> = Kicker
Let’s start with the kicking game, which is currently 5 points below average on the season and rated third worst in the country after the first three weeks.

Assumptions: Top 20 offense, average defense, average punt game, below average field goal kicker (FG make odds are reduced by 25% everywhere on the field).
The decisions near midfield obviously aren’t changed but now attempting a field goal on 4th and 5-9 from inside the 25 is no longer the most valuable option.
<blank> = Punter
I know it hasn’t been the most Zoltanic of starts for Will Hagerup, but at this point if he can hold onto the snap, there is no point in adjusting him to below average, even if he isn’t an advantage at this point.
<blank> = Defense
This is the one that seems a bit counterintuitive and Brian and I disagree on. I say that the strength or weakness of your defense is irrelevant to your offensive decision on whether or not try a fourth down conversion. My belief that it is irrelevant is based on this chart.

Great defense obviously give up fewer points than bad defenses but the key point is that the difference between a great defense and a bad defense is consistent up and down the field. Giving the opponent a first down at midfield isn’t a guarantee of a touchdown even with a bad defense and isn’t a guarantee that pinning an opponent deep against a great defense will keep the other team off the board. In fact, the gap between the two is about .25 points per first and 10 all the way from the 1 to the 90. If this is true, then the ability of the defense is irrelevant to the offense’s decision to go for it. For that to be the case, there would have to be evidence that the difference between a good defense and a bad defense changes at different points on the field.
So what does all this mean
If Michigan can maintain their feverish offensive pace this year and fail to find an adequate kicker, I think their decision set in all but late game score specific situations should look something like this:
As I noted previously, if you buy into this mentality, it opens up another opportunity, changing your early down play calling. If your four down strategy has changed, so should your down by down playcalling. It may become more viable to risk a wasted down with deep ball knowing that you have an extra, or it might just make sense to keep the ball short in the air and on the ground knowing that over four plays instead of three the likelihood of getting the yardages greatly increases so play to have the shortest possible fourth down attempt if you don’t convert before that.
[ed: bump.]
Pulling the content a little closer to home this week in an effort to keep a higher R squared value with the MGoBlog readers!
As always, this analysis only considers games between two D1 opponents and takes only plays during competitive game situations into account.
Not all great offenses are created equally
If we are going to know what it takes to become a great offense under Rich Rodriguez, we must first know what it will look like, because great offenses can take on many different appearances. Below is a play success distribution for my top rated offense last year (Georgia Tech, option baby), the top passing offense (Captain Leach Texas Tech) and a look at West Virginia from 2007, Rodriguez’s last year at the helm. I went ahead and threw in the BCS’s worst, Washington St, just for comparison.

The Paul Johnson option is working with big plays, rather they are taking out the bad plays. Over three-quarters of Georgia Tech’s plays go for positive yardage. This balances out no strong tendency towards big plays. The end result is old school football: lots of long drives and moving the chains.
At the Captain’s helm, Texas Tech had nearly a quarter of all of their plays go for no gain. As always, there are tradeoffs. For Tech they came in the form of the 10-20 yard gain.
Under Rodriguez, West Virginia saw something different than either of those two. Even with a run-pass split close to Georgia Tech, the distribution of the spread 'n' shred was much different than the Option. Where the Yellowjackets saw a heavy dose of positive but small gains, the Mountaineers had a solid lead in everything from 4-20 yards. The end results where similar with both teams producing touchdown drives with regularity, but the path was much longer for Georgia Tech. West Virginia’s ability to get the somewhat big play allowed them to shorten drives, add possessions to the game and eliminate some of the variance through an increase in scoring chances.
How close are we?
As everyone knows, we are much closer coming in to this year than we were last year. Here is another chart to support that notion.
 There are many charts to look at that show the dreadfulness of 2008, so we won’t dwell on that. What is becoming clear is that the shape of 2009 is becoming quite similar to West Virginia 2007. The big difference, and its a big one, is that Michigan still has a lot of plays going for no gain, where West Virginia was able to get 5+ yards out of those same plays.
If Michigan is going to mirror the West Virginia offensive success, it appears to have a made very clear first step last season.
How does this compare to previous years?
 The biggest difference between the Carr era and the Rodriguez era in terms of yardage gained distribution is the passing game bump from the Carr era in the 10-20 yard gain range. The Rodriguez system is more geared towards to the 4-9 yard gains where the Carr offense excelled in the 0-3 and 10-20 yard ranges.
What does this mean for 2010?
The cliché: Take the Next Step.
It looks like framework of what Rodriguez wants to do is in place after two rough years, but the execution is still behind his days at West Virginia. The offensive line now has two years in the system and for the first time there is a quarterback (in fact two!) who have both experience and talent. As I noted in a previous diary, a jump from average in 2009 to good in 2010 is certainly a good possibility and with a break or two and improved quarterback play, it could go from average to great.
[Ed: meant to bump this sooner but there was a lot of stuff yesterday.]
After the disastrous offensive performance of 2008, the 2009 Wolverine offense really had nowhere to go but up. Using my offensive ratings, the 2008 Michigan offense was 7.4 points per game below average, 107th out of 120 FBS teams. 2009 brought another year in the system and real quarterbacks and huge improvements. While far from consistently excellent, Michigan moved up to a modest 1.2 points per game above average, 50th nationally. No one outside of the eternal optimists like Fred Jackson could see another 57 place ranking improvement, but what has happened to teams that have shown big offensive improvements in year in the following year.
Presently my database has the 2007-2009 years completed, just enough for a 3 year case study. From 2007 to 2008 there were 28 teams that improved offensively by at least 5 points per game. I broke those team into three categories, teams that saw a second major (+5) increase in the third year, teams that saw a major (-5) regression back in the third year and teams that were in the middle and didn’t necessarily continue gaining, but didn’t fall back much either.
The Regressers
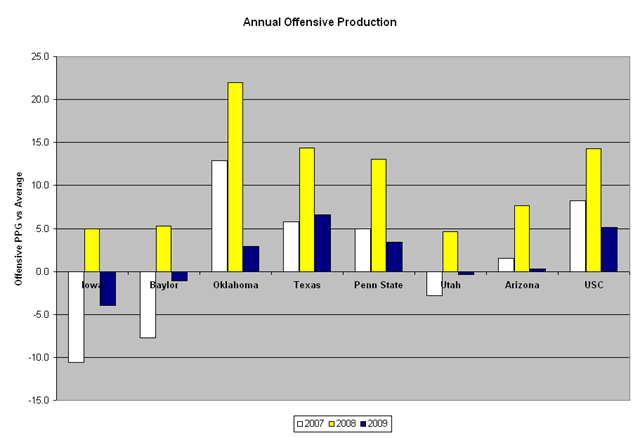
*Only BCS teams shown
With 14 of the 28 teams in this group, half of the teams that show big gains can expect a return to the mean the next season. In fact, these teams were worse offensively in 2009 than they were in 2007, let alone the beacon season of 2008. The average team in this group was 2.5 points per game worse in 2009 than they were in 2007 before they peaked.
The closest thing to a consistent thread is the quarterback possession as five of the eight, Oklahoma, Baylor, USC, Arizona and Utah, spent most or all of the season with a new quarterback.
In general, the regressers look like a group that is just regressing to the mean and that replacing a quarterback is damaging when your success has not been sustained for longer than a single season.
The Holders

With the exception of Alabama, these teams were pretty average in returning starts and had no major position group gaps to fill. Alabama had a new quarterback and was 97th in returning offensive starts nationally, the ability to sustain the offensive success is likely attributable to the influx of talent Saban brought into Alabama since he arrived.
The Gainers
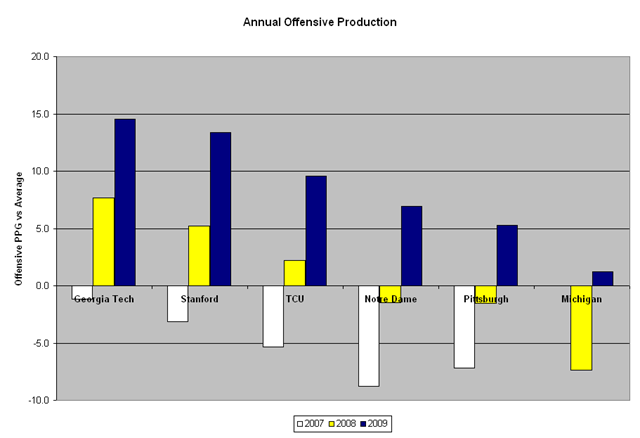
*Michigan 2007 results omitted (-1.1)
With a relatively new coach and a total offensive system overhaul, Georgia Tech is clearly the most similar situation to Michigan and their path is one that Michigan would be thrilled to follow. Tech went from –1.1 ppg in 2007 to 7.6 in 2008 to 14.5 and my top rated offense in the country in 2009. Even though Johnson and Rodriguez were hired the same year, the Michigan offense is about 2 years behind Georgia Tech. Georgia Tech went from average to very good to best in the country. Michigan went from average, to very bad and back to average. Even with the offset timeline, Michigan seems comparable to Georgia Tech’s situation and therefore a second year of offensive gain seems very possible under this comparison.
All five of these teams either returned 20+ starts at the quarterback position (except GT who had the same quarterback from the start of the system), although Stanford’s returning quarterback was replaced. The other major similarity between these schools in neither of the last two years did they have stratospheric gains, there is less flukiness to these teams success.
When looking at the progression from very bad to roughly average, there are four BCS level schools who showed that same progression. Three of those (TCU, Notre Dame and Pittsburgh went on to see big gains in year 3 as well, and NC St still saw modest improvement. Teams fitting this profile for a potential second year of strong offensive progress in 2010 along with Michigan include Kentucky, UConn, Wake Forest and Mississippi St.
Conclusions
Although teams that show a big jump like Michigan last year are more likely to fall back than continue the progress, the recruiting profile, experience at quarterback (even if the returner loses his job), progressions comps and system change all point to Michigan as being a good candidate to at least sustain and probably show more improvement next year. Every 3 point gain is worth about one additional win on the season and based on this look I would say that from the offense alone, a 3 point gain seems likely and a 6 point gain entirely possible.
97