U-M vs. ND is for All the Win Percentage Marbles.

NOTE: This is an update of a diary that I did in 2016. It's now pertinent again, given the stakes of the September 1 match-up in South Bend.
The reboot of the Michigan / Notre Dame football series will have monumental stakes in the race for top all-time winning percentage. In fact, Notre Dame will take over the lead again if the Irish beat Michigan in this year's opener.
The current records of the schools are:
MICHIGAN: 943-339-36, 1318 GP, .7291
Notre Dame: 906-324-42, 1272 GP, .7289
(Note that the NCAA figures a tie as half won and half lost.)
A Michigan win on September 1 will result in a Michigan lead of .7293 to .7282. A Notre Dame win on September 1 will result in a Notre Dame lead of .7290 to .7286.
Anyone want to delve deeper into the history of the race for all-time best winning percentage and most all-time wins?
All-Time Best Winning Percentage:
Until 2004, for decades Notre Dame easily had the highest all-time winning percentage among all schools. I suspect that during most of that time, if Michigan was not #2, it was at least third or fourth on the list; the point-a-minute era gave Michigan a good head start over most schools, Crisler righted the ship a bit in the ‘40s, and then Bo came along.
Notre Dame first overtook Michigan in all-time winning percentage in 1920, as the Rockne Era was just ramping up and Fielding Yost was starting to slow down a bit at Michigan. The big day was October 23, 1920, when Michigan lost to Illinois and Notre Dame beat Valparaiso; Notre Dame slipped ahead that afternoon, .7917 to .7898, and didn’t look back for more than 80 years.
Flash ahead to the end of the 2003 season, when Notre Dame’s 84-year lead was shaved to just .0001 after Chris Perry and John Navarre beat Ohio State with Notre Dame not playing that day.
On opening day in 2004, Michigan took over the lead, .7461 to .7454, with a win over Miami (Ohio) and a Notre Dame loss at BYU. But the very next week in South Bend, Garrett Rivas kicked field goals instead of a rookie Chad Henne throwing touchdowns, and the unranked Irish upset the Wolverines 28-20. Notre Dame retook the lead, .7457 to .7454, and maintained that lead for three weeks. On October 2, Notre Dame lost to Purdue and Michigan won at Indiana to retake the lead .7461 to .7456; this time, instead of just a week, Michigan would hold a very thin lead for nine years.
December 28, 2013 was our next pivotal moment, with Michigan losing to Kansas State in the Buffalo Wild Wings Bowl and Notre Dame beating Rutgers in the Pinstripe Bowl. Notre Dame retook the lead, .7330 to .7324, and held on for a few years.
The schools flip-flopped again on September 24, 2016 when Michigan demolished Penn State in Ann Arbor, 49-10, and Notre Dame did its best impression of basketball season by losing to Duke in South Bend, 38-35. Michigan now led by the narrowest of margins, .7307 to .7306. Interestingly, starting with the 2016 opener Brian Kelly awarded an honorary #1 jersey to be worn by a different player each game, to celebrate the Irish having the best all-time winning percentage. This tradition lasted all of three weeks.
That brings us to where we are now, with Notre Dame's 10-3 against Michigan's 8-5 last season setting up the game for the whole enchilada.
Looking ahead, if you’d easily like to predict the course of the percentages over the season, given the two schools’ number of games played and percentages of past wins and ties, a win these days raises the school’s percentage by about .0002. A loss lowers the school’s percentage by about .0006.
It’s fascinating to look at a graph of the two schools’ season-end winning percentages over the past century-plus...
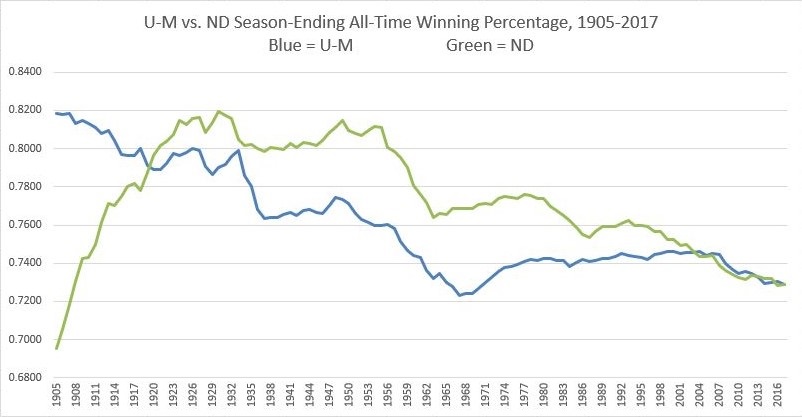
The rise and fall over the last 100 years is nearly identical. Rockne took the lead over from Michigan and built it up. Both schools experienced similar drops in the 1930s until rising again in the Leahy and Crisler years. Both took dips again in the 1950s. Ara Parseghian and Dan Devine righted the ship for the Irish in the ‘60s and ‘70s, and Bo did the same for Michigan. The difference then was that aside from Lou Holtz’s uptick in the late ‘80s, Notre Dame experienced a slow but steady decline starting with the Gerry Faust years, while Gary Moeller and Lloyd Carr continued slowly but surely to maintain and slightly build the numbers for Michigan.
After Michigan’s first two seasons of play, the highest winning percentage the Wolverines ever reached was .8228, on November 25, 1905. Michigan beat Oberlin at Regents Field that day, 75-0, in the last win of Fielding Yost’s amazing point-a-minute unbeaten streak. The next week Michigan would lose to Chicago 2-0 at Marshall Field in “The First Greatest Game of the Century” when Amos Alonzo Stagg had finally bought enough players to beat Yost (plug for John Kryk's fabulous and fascinating book: "Stagg vs. Yost: The Birth of Cutthroat Football").
NOTE: Michigan’s winning percentage after its first game in 1879 (1-0 all time) was 1.000; Michigan’s winning percentage after the 1880 season (2-0-1 all time) was .8333. It seems silly to count these as high water marks though… like something MSU would do.
Notre Dame’s highest ever winning percentage was .8221, reached on November 14, 1931 in a 20-0 win over Navy in Baltimore. The Irish would lose their next game at home to USC, 16-14.
So not only do the schools' historical rise and fall in percentage roughly match on the graph, but each school reached its historical apex at roughly .822, and could climb no higher.
Biting at the heels of Notre Dame and Michigan are (current percentages through 2017 bowl season):
1. MICHIGAN .7291
2. Notre Dame .7289
3. Boise State .7273
4. Ohio State .7251
5. Oklahoma .7247
6. Alabama .7236
7. Texas .7049
Ohio State is particularly alarming on that list, given (1) the recent gaudy record juggernaut in Columbus that doesn't look like it's stopping anytime soon; and (2) a Michigan loss to Ohio State (or any given week in which Michigan loses but Ohio State wins) corresponds to a roughly .0008 swing in all-time percentage. The gap between Michigan and Ohio State at this point amounts to a swing of only approximately 5 games. Michigan really needs to stop losing to the Buckeyes, obviously. Alabama is dangerous too... only 7 games behind Michigan. It's tough to respect Boise State on that list; they've played half the games of everyone else up there.
All-Time Number of Wins:
Michigan started playing football nine years before Notre Dame, and played more games than the Irish did in Notre Dame’s first few years. As of today Michigan has played 46 more games.
Michigan always had a commanding lead on Notre Dame in number of wins until the 1960s, when Bump Elliot’s lean tenure at Michigan coincided with Ara Parseghian’s reboot of Notre Dame’s program.
Notre Dame finally caught Michigan in all-time wins on November 24, 1967. On the day after Thanksgiving, Notre Dame won at Miami to tie Michigan’s 501 wins; Michigan lost the next day to Ohio State, and the teams would open 1968 tied.
1968 opened with Notre Dame beating Oklahoma and Michigan losing to California, for a ND one-win lead. The next week the tie was on again, with a Michigan win at Duke and a Notre Dame loss to Purdue. Bump’s last season was one of his best, and Michigan didn’t lose a game the rest of the way except to Woody Hayes’s national champs; 1968 finished with Michigan one win ahead, 509-508.
Bo kept that one-win lead through 1969, with the year finishing 517-516, advantage Good Guys.
Notre Dame would tie Michigan again at the end of the 1970 season, with a win over No. 1 Texas in the Cotton Bowl; 526-526.
Michigan finally pulled ahead for good in 1971; right away Michigan beat Northwestern for win #527 while Notre Dame didn’t play on opening weekend. Michigan’s 11-1 season vs. Notre Dame’s 8-2 put Michigan ahead 537-534. Notre Dame kept relatively close to Michigan until 1981, when ND’s 5-6 record really put them behind the 8-ball against Michigan’s 9-3.
As with winning percentage, in total wins Michigan was greatly helped by the Bo/Mo/Lloyd relatively steady hands at the wheel while ND foundered with Gerry Faust, Bob Davie, Tyrone Willingham, and Charlie Weis. And Bo’s record in the ‘70s was good enough to leave just about everyone in the dust, even Ara Parseghian and Dan Devine.
A few seasons back, before Texas fell off the cliff for a few years, the Longhorns briefly moved ahead of Notre Dame for #2 on the wins list. Now Ohio State has overtaken Texas and is nipping at Irish heels.
Next up on the wins list behind Michigan and Notre Dame are:
1. MICHIGAN, 943
2. Notre Dame, 906
3. Ohio State, 898
4. Texas, 897
5. Oklahoma, 896
6. Nebraska, 893
7. Alabama, 891
August 16th, 2018 at 11:34 AM ^
Notre Dame was ordered in February to vacate their wins from the 2012 and 2013 seasons, so they're actually not particlarly close. They now have 886 official wins and the 4th best all time winning percentage.
August 16th, 2018 at 11:59 AM ^
Yes, yes, yes, but NCAA decision or not, those games were actually played. It's nice having the cushion that the vacated wins provides, but I'd rather be ahead of ND straight up. And honestly I would not be surprised if those wins are restored at some point.
August 16th, 2018 at 12:14 PM ^
Cheating doesn't make things "straight up".
August 16th, 2018 at 11:50 PM ^
The NCAA already heard an appeal on restoring them and declined it. Can’t see that being revisited.
August 16th, 2018 at 11:36 AM ^
I thought the vacated wins from 2012/13 put us squarely ahead...
Whatever this site is has ND listed at 4th in win percentage (.724), and 6th in wins (886).
August 16th, 2018 at 11:56 AM ^
4 teams are going to win their 900th respective game this year:
Ohio State needs 2 wins
Texas needs 3 wins
Oklahoma needs 4 wins
Nebraska needs 7 wins (not likely, looks to be a 4 or 5 win season)
Alabama needs 9 wins
I hope they all have miserable seasons.
August 16th, 2018 at 11:57 AM ^
thorough. thanks!
August 16th, 2018 at 4:01 PM ^
Nice research and information but I do feel like your diary needs at least a mention of the ND forfeited games in the main body. No matter your feelings or perspective on the matter, it's more than just a footnote - it's the official position as of now.
August 16th, 2018 at 5:20 PM ^
He can't edit the Diary itself.
August 16th, 2018 at 4:01 PM ^
Ugh, really over the win percentage thing. Nobody cares except us and Notre Dame, and even they have come closer to threatening for a national championship more recently than us.
August 16th, 2018 at 5:20 PM ^
Really? OSU and/or Bama will start to care once/if they are #1, You can bet on that.
August 17th, 2018 at 8:58 AM ^
I really doubt it. Alabama has won a ridiculous number of national championships which is the ultimate goal.
August 16th, 2018 at 5:46 PM ^
I really liked your research, thanks. Its' great to know that the game has certain meaning. Also I'm of the opinion that I'll allow ND the vacated win handicap for purposes of this competition.
Also was it just me or did anyone else want to plug in 10 year (100 day) MWA and fibonacci lines on that graph of winning percentage over time? It looks like the teams are testing each other's winning percentage for the third time in ten years. I could see it falling off for the loser of this game. I suppose if I am looking at purely technicals, I am most happy that ND has not yet hit its lowest low (has been hitting sequential lowest lows), and Michigan appears to be testing the low of a ten year trough. I'd take this as a technical sign to buy Michigan over ND in a heartbeat.
August 17th, 2018 at 1:31 AM ^
We should easily pull this off, and maybe it's a petty thing, but I really, really, really want us to reach 1,000 wins before everyone else. These things tend to get blown out of proportion - you just know there'll be quite a bit of talk leading up to whatever game it turns out to be. And with the lead we've got, blowing it'd have to entail a lot of suck. And pain. And be another thing that would be talked about too much.
Figure it should happen during the 2023 season . . . maybe 2024 if not enough good stuff happens.
August 17th, 2018 at 11:46 AM ^
That is a depressing line chart...
August 19th, 2018 at 11:16 AM ^
I've been so used to being #1 or #2 in win percentage that I didn't realize how close the other schools were getting. Hopefully we can kick it into high gear going forward; 5 and 7 seven games are not very large margins, especially when OSU and Bama are winning 11-14ish games a year.
August 19th, 2018 at 9:00 PM ^
That was exactly my thought. OSU is only 45 wins behind us thanks to this crappy decade we've had. Sheesh.
Comments