Downs And Success And Differentials: A Further Look
DOWNS AND SUCCESS: A FURTHER LOOK
After not finding as much as I thought I would in the initial delve into this subject, a few suggestions from other MGoBlogger and some folks on Twitter proved to be rather enlightening (thanks to Tenn Blue and jamiemac in particular). I was taking an incomplete approach to this subject, and in some respects, one that might be a little too broad to find much.
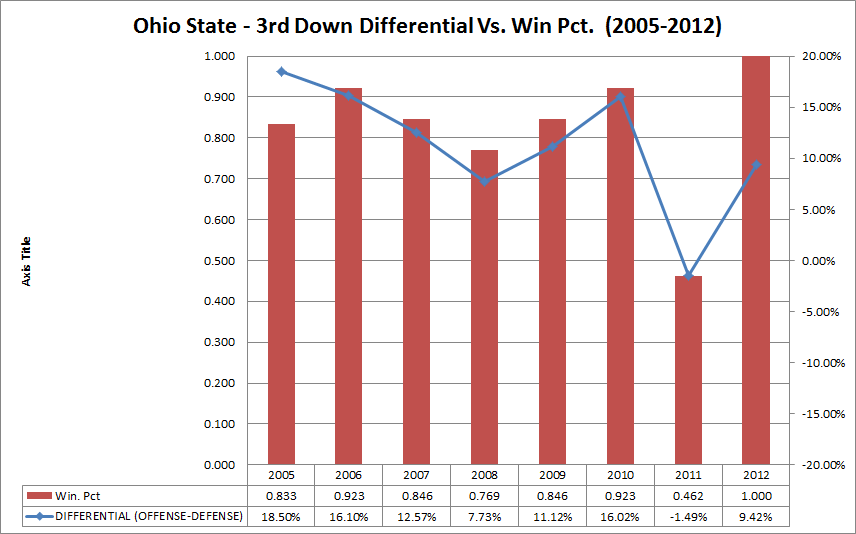
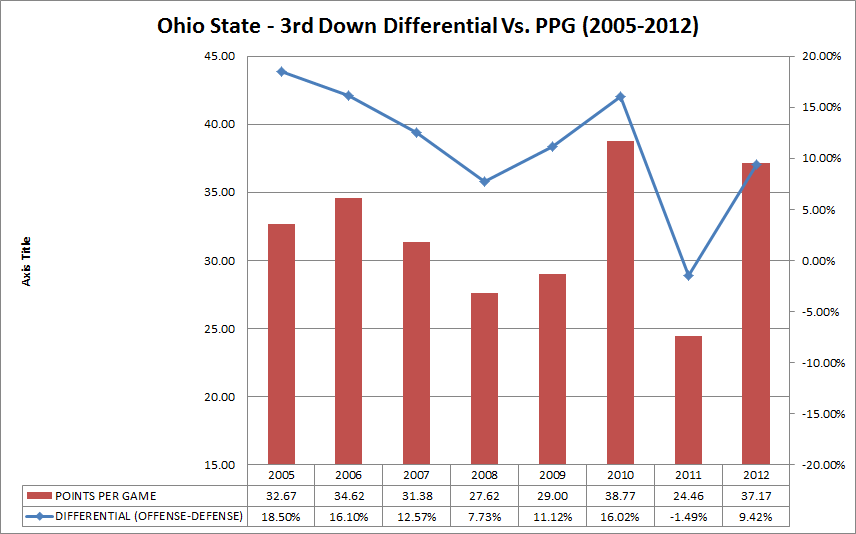
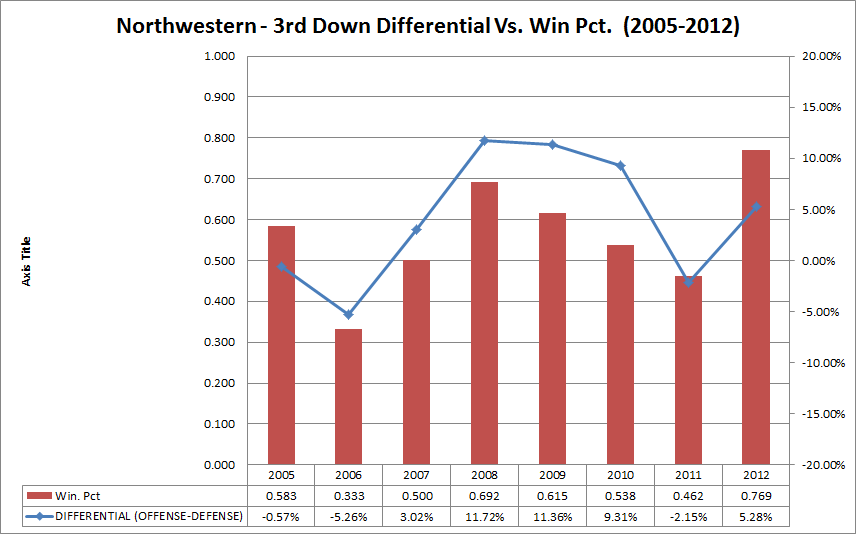
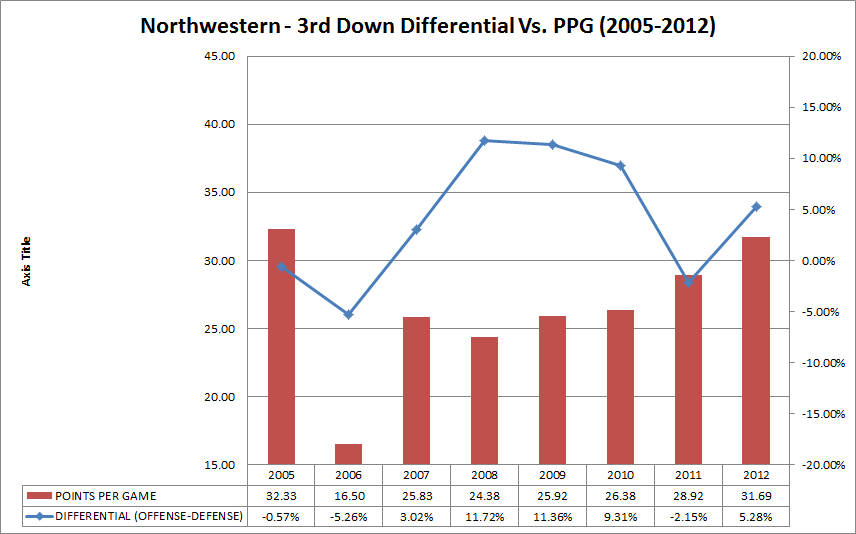
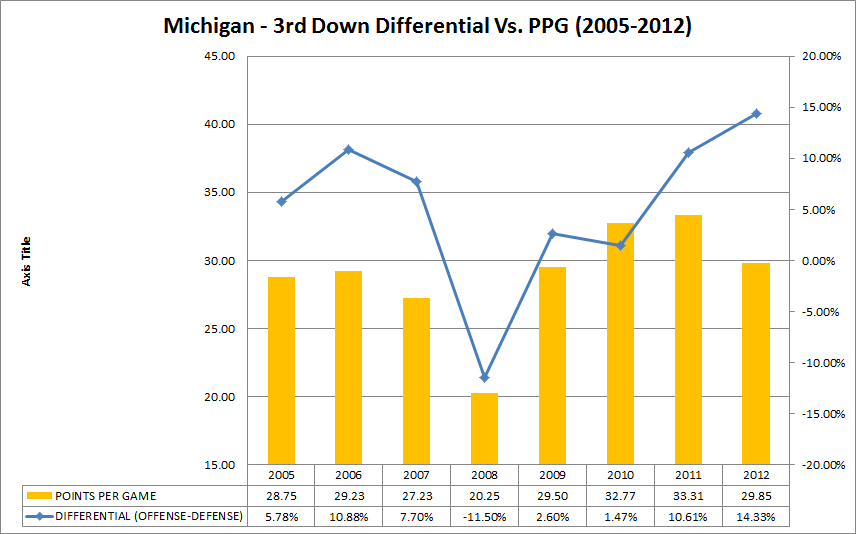
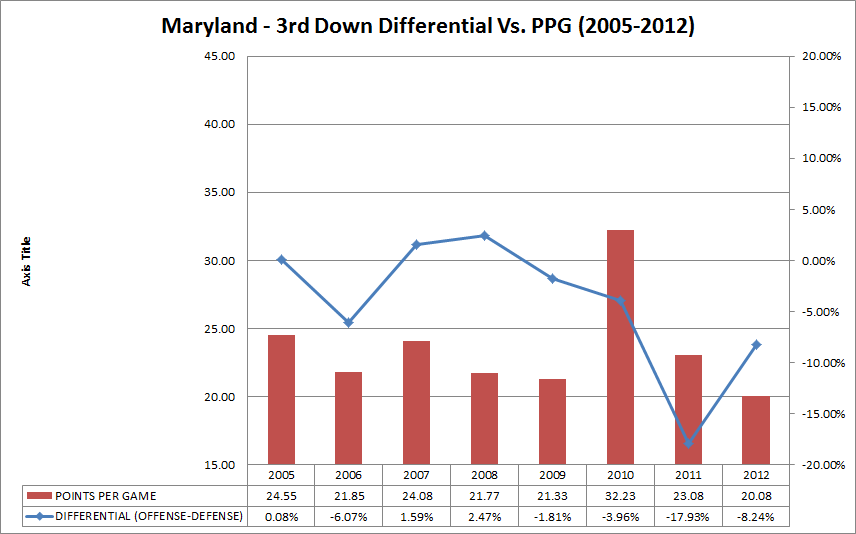
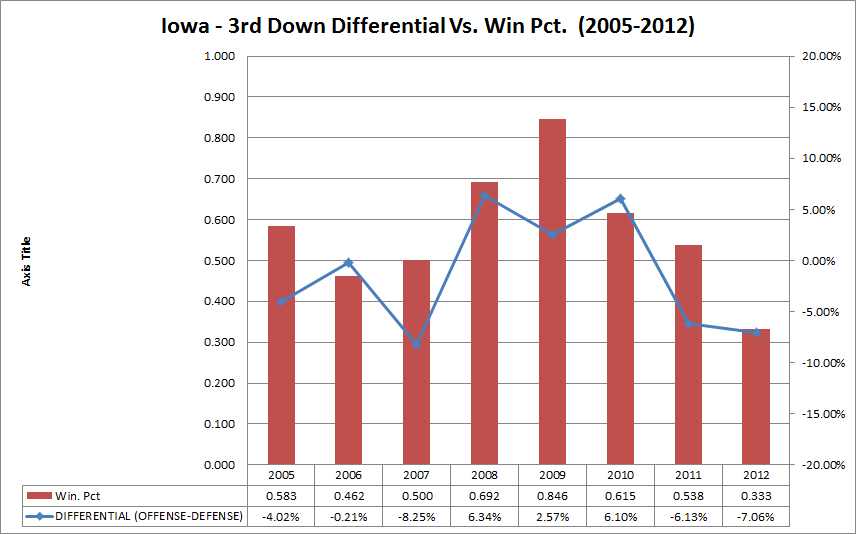
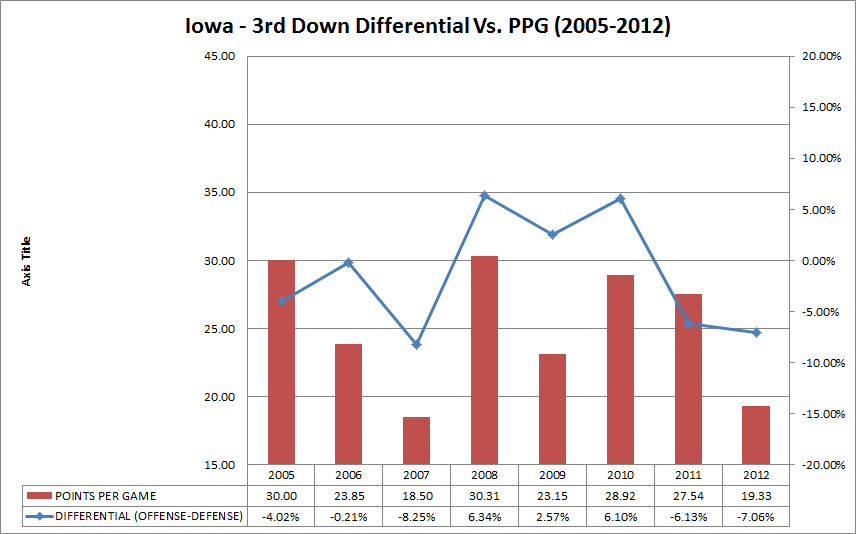
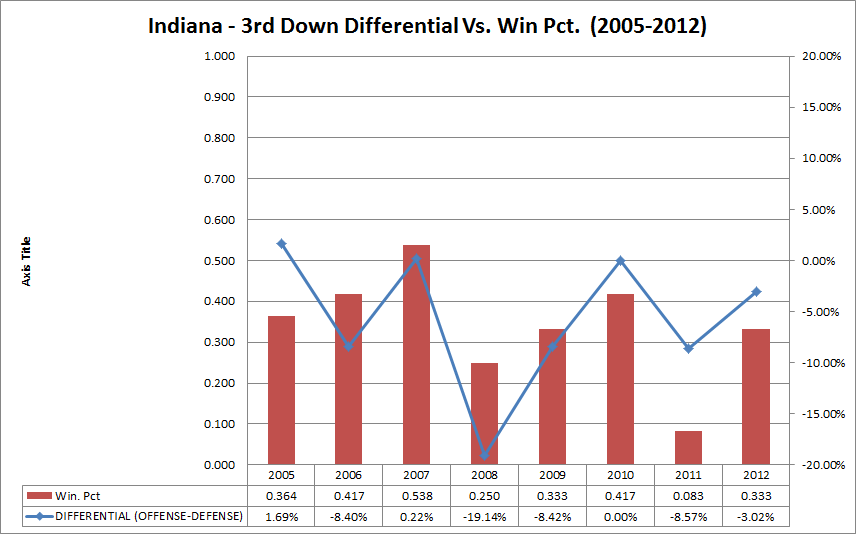
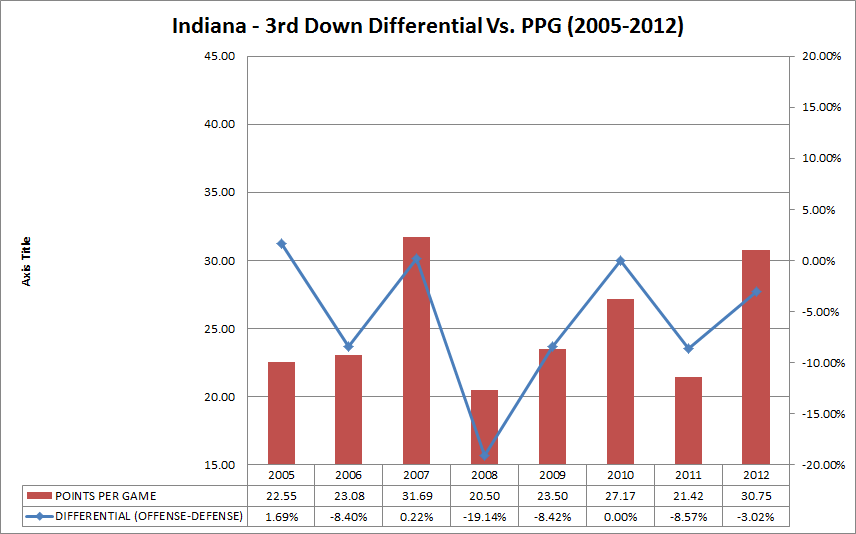
So, I limited this to 3rddowns because that is where some of the better relationships seem to be, and then I calculated both the conversion rate on offense and the conversion percentage on defense for each team. Next, I subtracted the defensive success rate from the offensive success rate to get a differential for each team and each year evaluated. I also took the suggestion to correlate this to certain aspects of scoring offense – for this run, I chose average points per game.
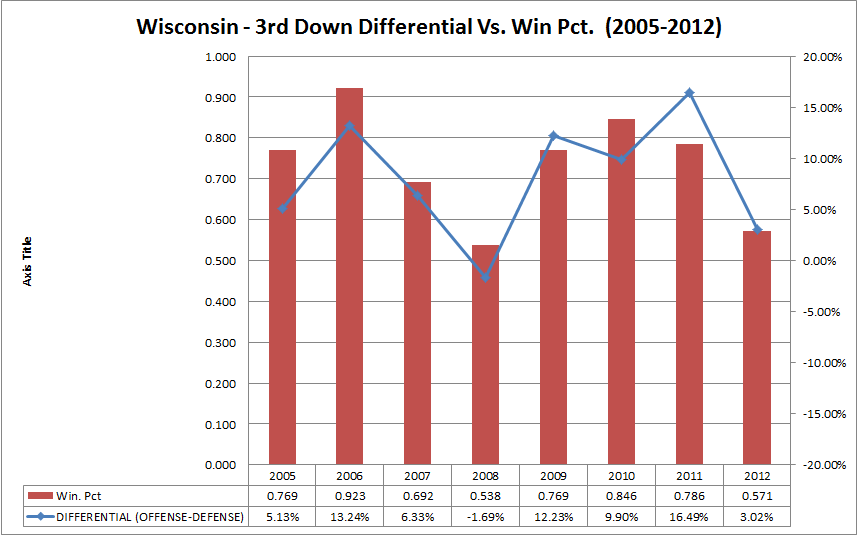
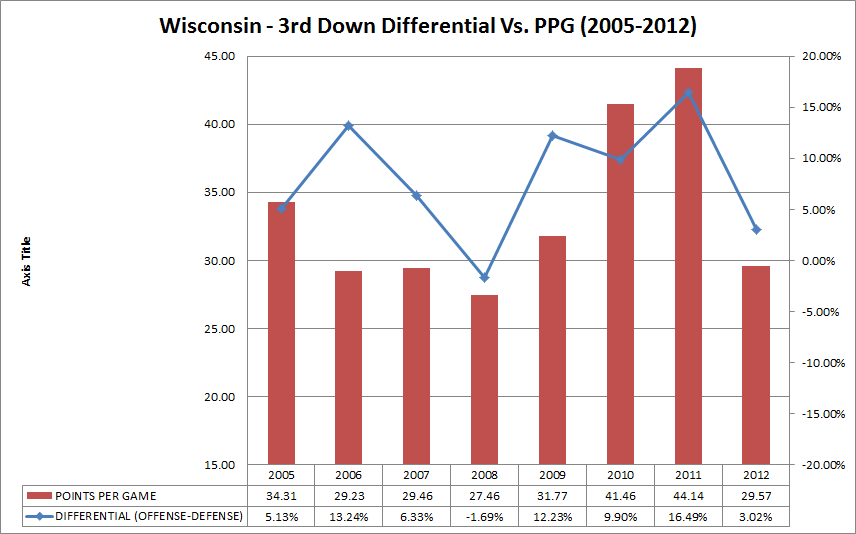
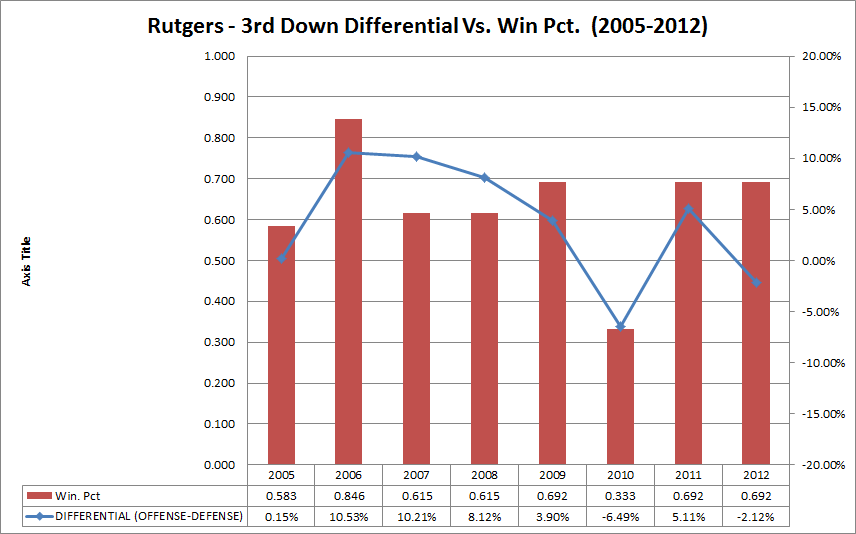
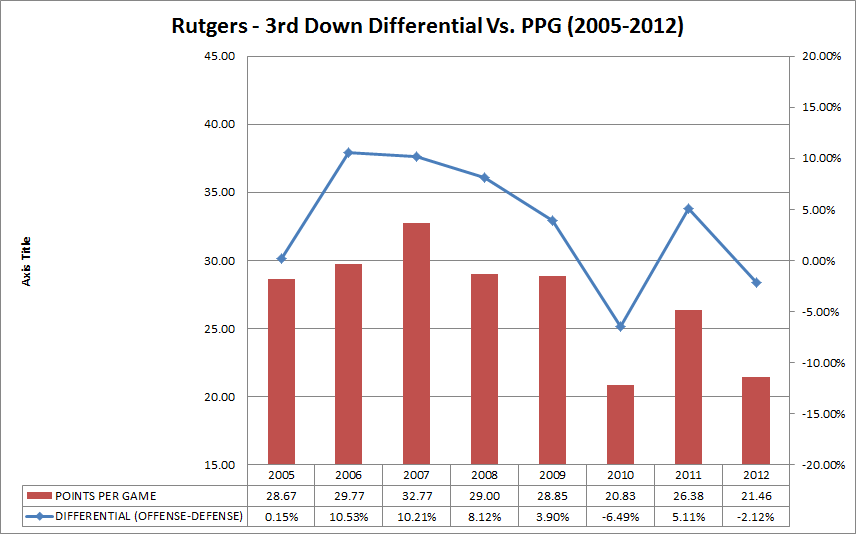
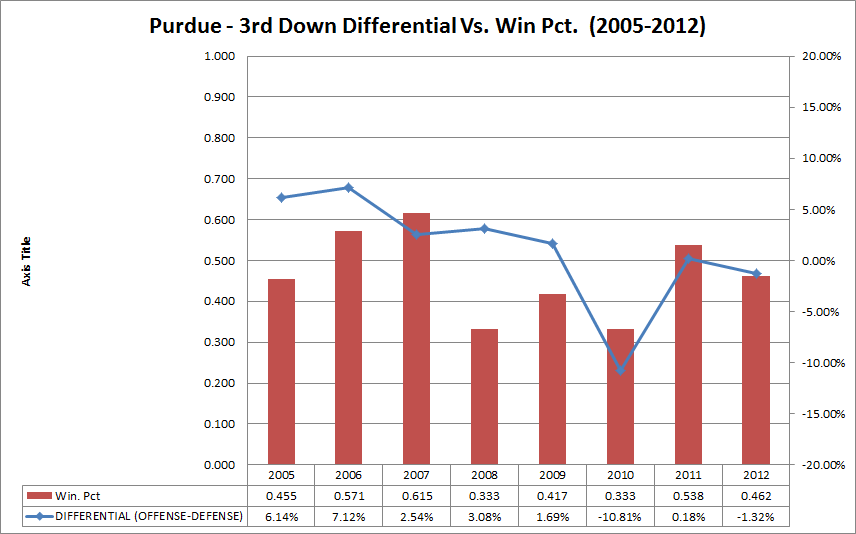
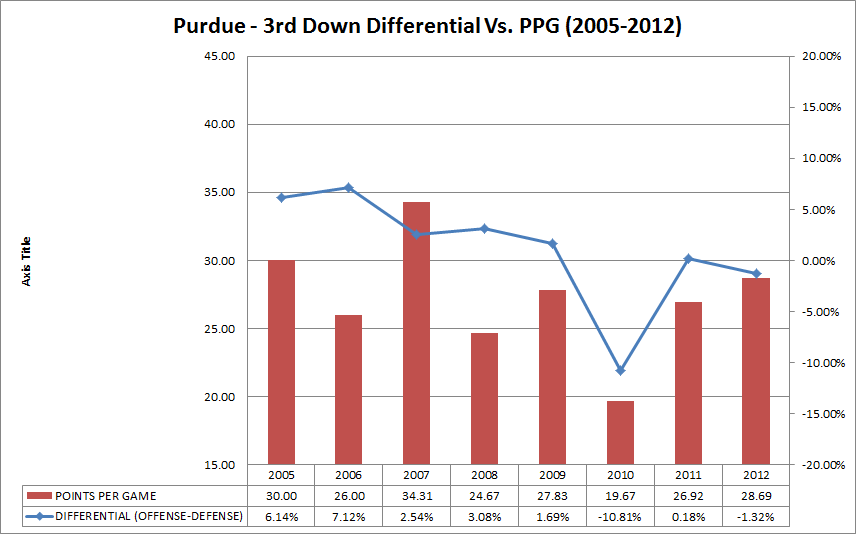
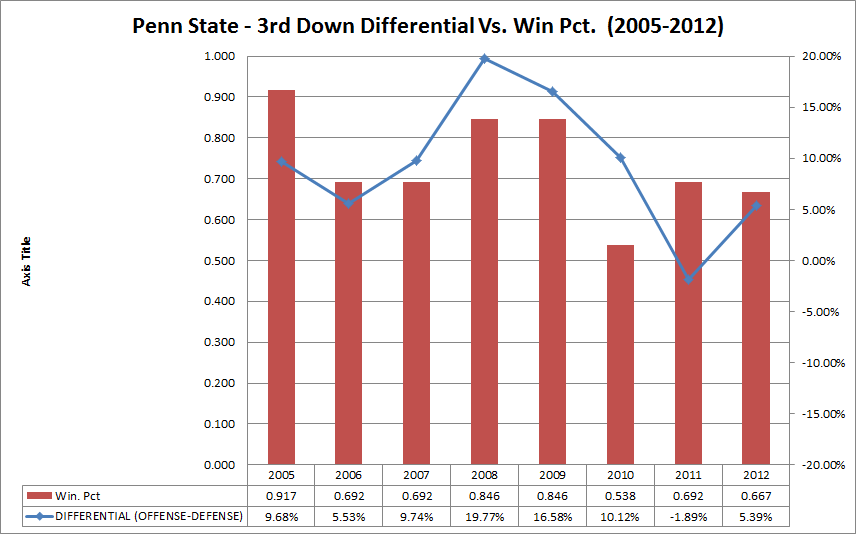
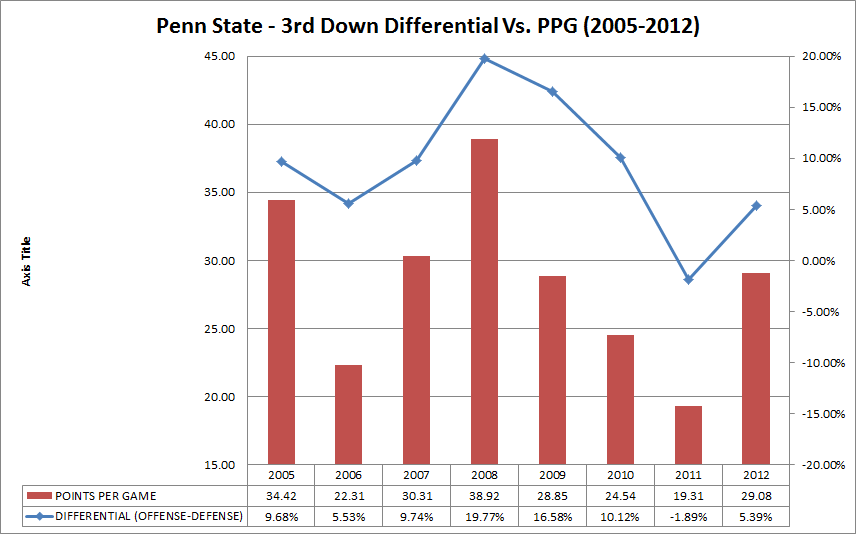
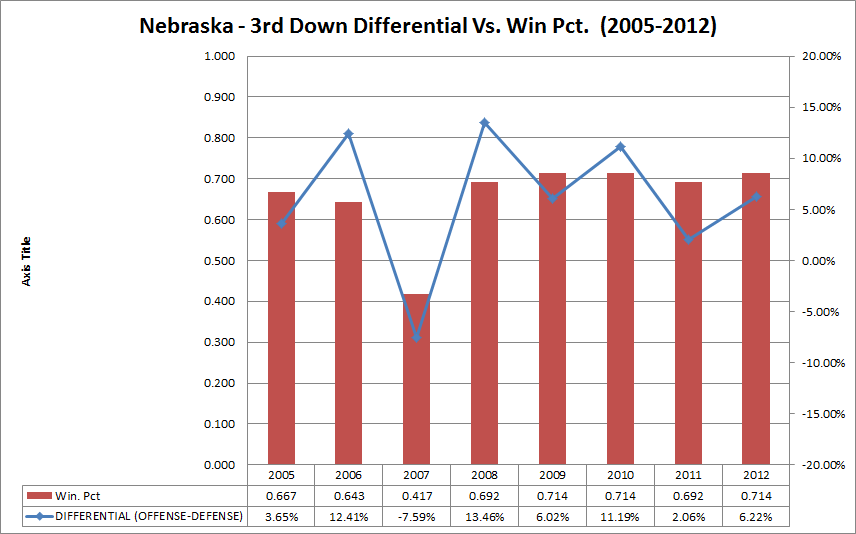
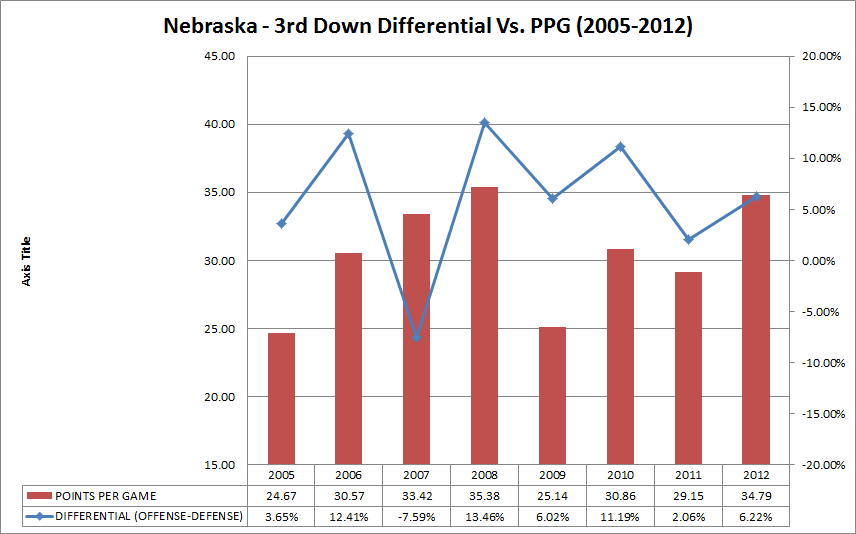
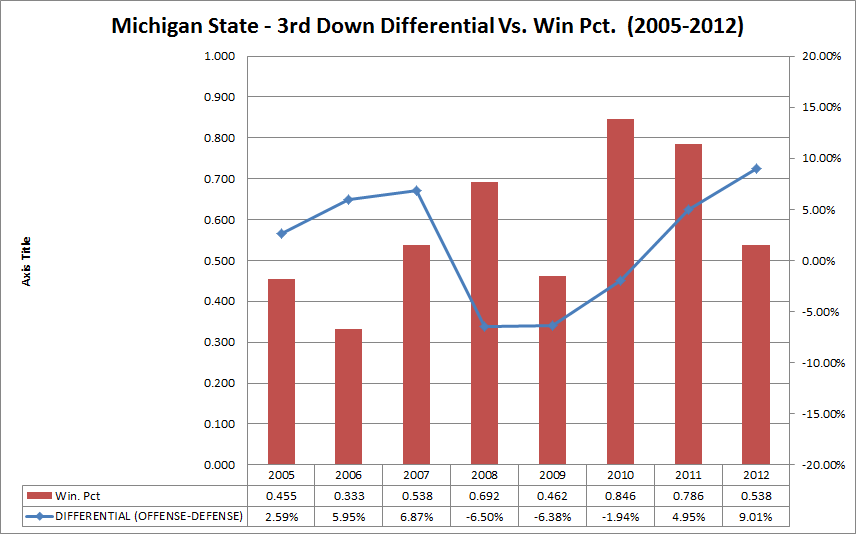
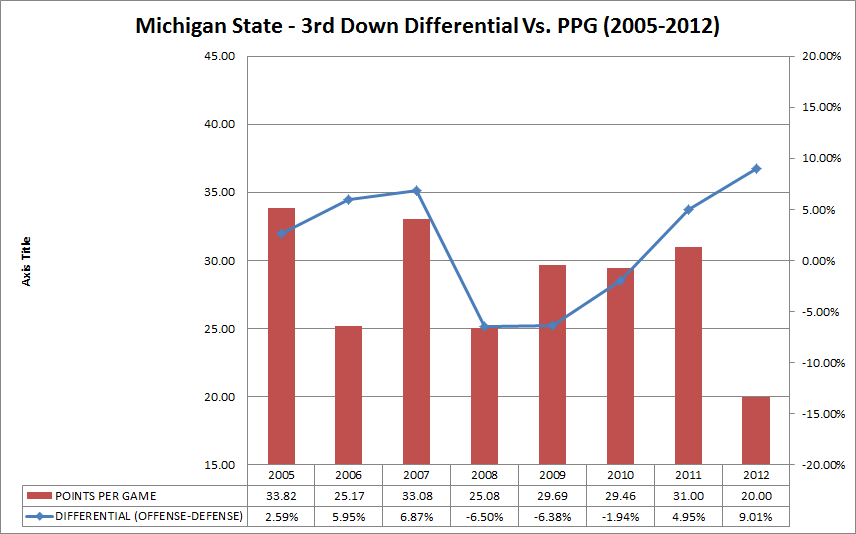
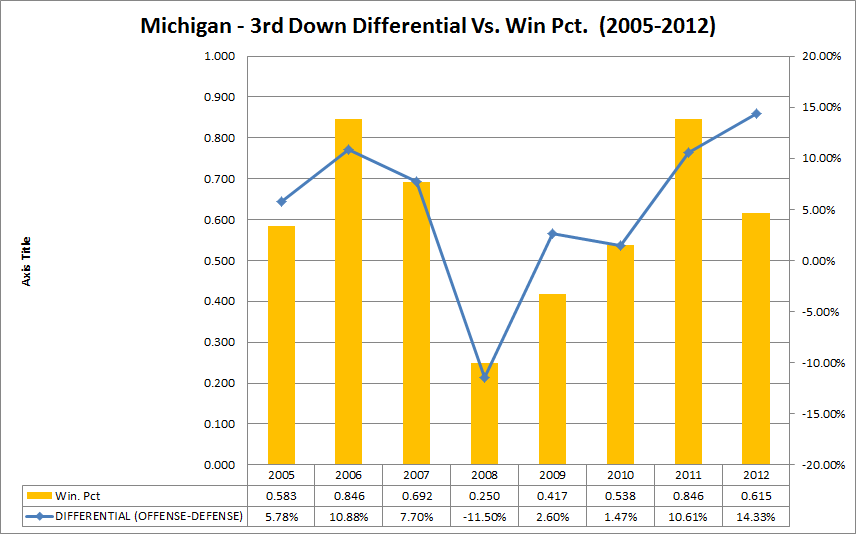
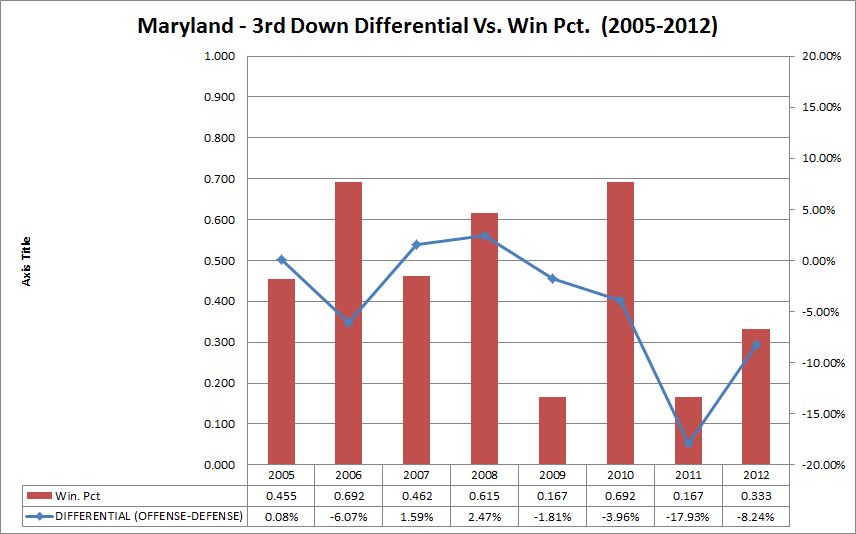
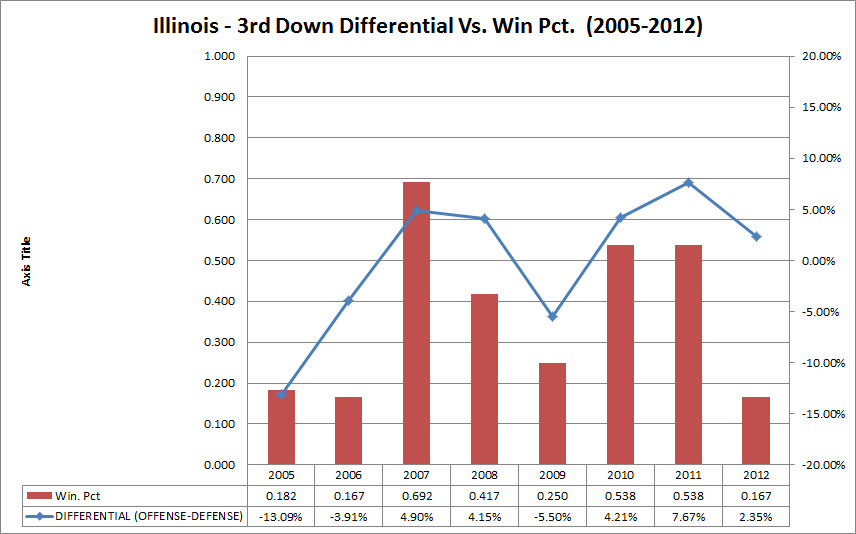
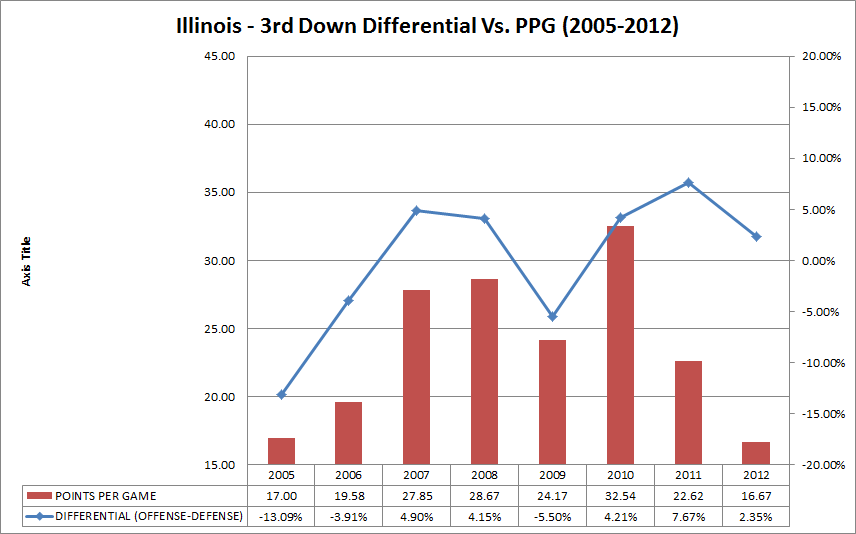
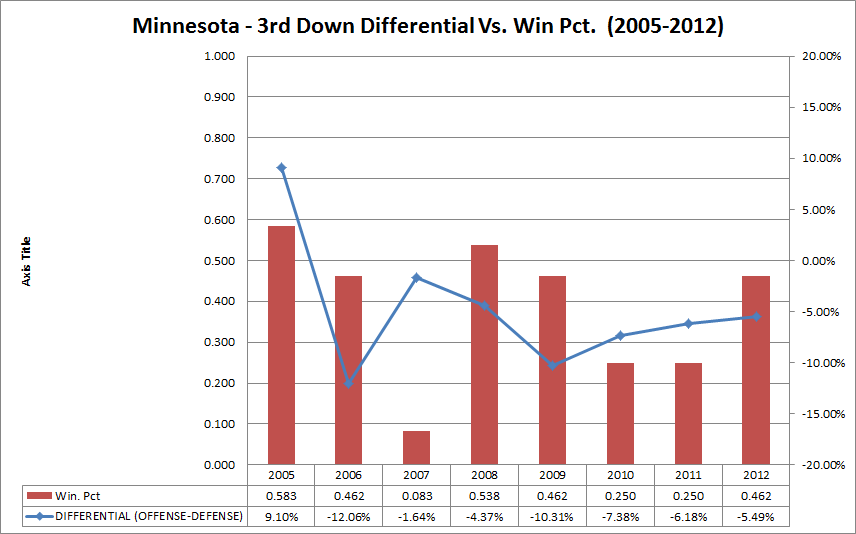
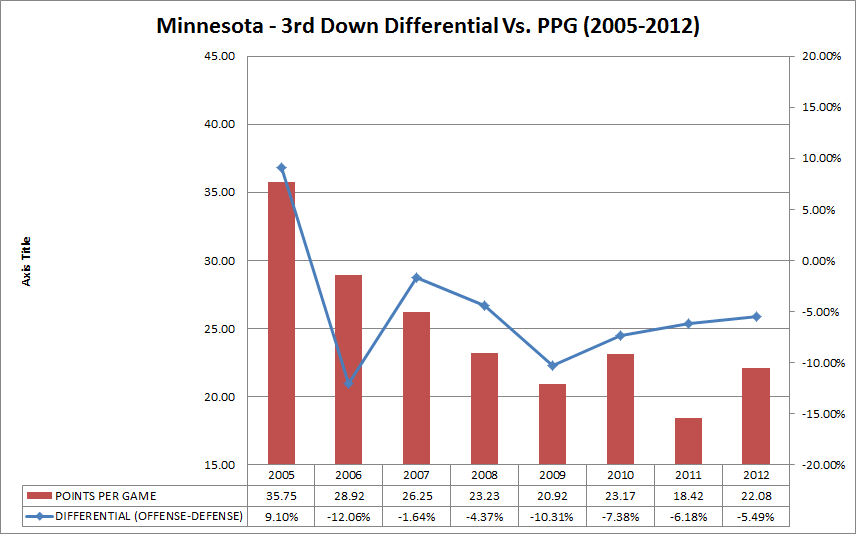
The R-value for the relationship between the differential and win percentage turns out to be 0.752, which is not bad at all. The R-value for the relationship between the same differential and average points per game came out to 0.659, so while not as good, the two share at least a casual relationship, as you will be able to see in the graphs below.
A FEW HIGHLIGHTS REGARDING THIRD DOWNS:
So, what did some of the better teams from the Big Ten (I included Rutgers and Maryland in here for kicks) look like when it came to success on getting conversions, stopping them on defense and winning?
The best ten from the Big Ten data set:
|
Year |
Name |
DEFENSE PCT |
OFFENSE PCT |
DIFFERENTIAL (OFFENSE-DEFENSE) |
Win. Pct |
|
2008 |
Penn St. |
32.26% |
52.02% |
19.77% |
0.846 |
|
2005 |
Ohio St. |
30.86% |
49.36% |
18.50% |
0.833 |
|
2009 |
Penn St. |
31.77% |
48.35% |
16.58% |
0.846 |
|
2011 |
Wisconsin |
38.22% |
54.71% |
16.49% |
0.786 |
|
2006 |
Ohio St. |
32.95% |
49.06% |
16.10% |
0.923 |
|
2010 |
Ohio St. |
30.18% |
46.20% |
16.02% |
0.923 |
|
2012 |
Michigan |
35.96% |
50.29% |
14.33% |
0.615 |
|
2008 |
Nebraska |
33.73% |
47.19% |
13.46% |
0.692 |
|
2006 |
Wisconsin |
28.18% |
41.42% |
13.24% |
0.923 |
|
2007 |
Ohio St. |
33.33% |
45.90% |
12.57% |
0.846 |
And to follow, the worst ten:
|
Year |
Name |
DEFENSE PCT |
OFFENSE PCT |
DIFFERENTIAL (OFFENSE-DEFENSE) |
Win. Pct |
|
2008 |
Indiana |
46.78% |
27.65% |
-19.14% |
0.250 |
|
2011 |
Maryland |
53.76% |
35.84% |
-17.93% |
0.167 |
|
2005 |
Illinois |
50.67% |
37.57% |
-13.09% |
0.182 |
|
2006 |
Minnesota |
48.81% |
36.75% |
-12.06% |
0.462 |
|
2008 |
Michigan |
38.78% |
27.27% |
-11.50% |
0.250 |
|
2010 |
Purdue |
43.03% |
32.22% |
-10.81% |
0.333 |
|
2009 |
Minnesota |
44.39% |
34.08% |
-10.31% |
0.462 |
|
2011 |
Indiana |
49.39% |
40.82% |
-8.57% |
0.083 |
|
2009 |
Indiana |
47.50% |
39.08% |
-8.42% |
0.333 |
|
2006 |
Indiana |
41.94% |
33.53% |
-8.40% |
0.417 |
You’ll note that Michigan has one representative in each of these tables of extremes.
Here is a general table which shows you what the average differential was in various ranges of win percentage.
|
WIN PCT. |
AVG. DIFFERENTIAL |
|
0.800 OR BETTER |
11.60% |
|
0.799 TO 0.700 |
8.36% |
|
0.699 TO 0.600 |
5.11% |
|
0.599 TO 0.500 |
2.49% |
|
0.499 TO 0.400 |
-2.03% |
|
0.399 TO O.300 |
-3.86% |
|
0.299 OR WORSE |
-7.86% |
THE POINTS PER GAME ANGLE:
I actually thought about going back and getting data on field goal attempts as well for this one, but I wanted to test out the relationship between this differential I was working with and the most basic statistic for scoring offense first. First, the 10,000 foot view of the relationship:
|
POINTS PER GAME |
AVG. DIFFERENTIAL |
|
35 OR MORE |
13.45% |
|
34-30 |
5.78% |
|
29-25 |
3.96% |
|
24-20 |
-2.48% |
|
LESS THAN 20 |
-6.01% |
FOR EACH TEAM:
Below are the comparisons of the 3rddown differential to both win percentage and points per game for each team in the Big Ten, including our soon-to-be conference compatriots.
CONCLUSION:
I was a little happier with the results of this, even though it again confirms something that you already thought about the game - the fewer 3rd downs that you convert on offense and the more that you allow your opponent to convert, the less you score and the worse you will do overall, at least most of the time. Like any sport, there are several things that confound this and created exceptions, such as teams that have good defenses but also middling offenses (like Michigan State).
OBLIGATORY:

August 7th, 2013 at 10:46 AM ^
what the differential would predict: OSU 2012 is really high, and Michigan 2012 is really low.
I'm not sure exactly what it means for OSU. Either they got really lucky last year, or Urban Meyer is a really fantastic coach? I'm leaning toward a serious dose of the former and a middling dose of the latter.
For Michigan, I would assume it's mostly luck and facing difficult opponents.
Edit: also, poor Illinois and Michigan State 2012
Yep, mostly luck. Two undefeated teams and, besides those teams, two national championship teams. Mostly luck though.
August 7th, 2013 at 11:28 AM ^
As usual, another great look at some statistical evidence. Thanks.
August 8th, 2013 at 12:58 PM ^
It's unclear (except from context clues) whether the defensive percentages are opponent's success rates on completing third downs, or defensive success rates for getting stops. I assume it's the former, but thought I'd suggest making that explicit. Nice work here!

Comments