Conference Scorecard At The One-Quarter Mark
Last year, I did (mostly) weekly stats reviews of the conference, but creating a dozen or so PNG files, uploading them to Photobucket then posting all of them in some order that made sense in the diary started to get cumbersome, so we’re going to do this a bit more corporate this year and run with a quick little scorecard (or three actually) built from the summary stats of the conference.
It also made sense to me to do this every three games as a “health check”, if you will, and of course after the first three, most Big Ten teams have had one or two tomato cans at least so this iteration probably will not be the most telling. The results so far are interesting all the same, however.
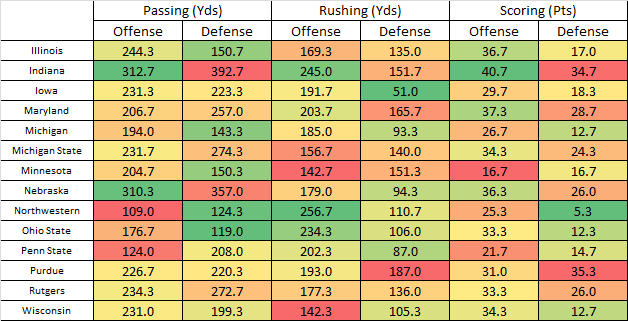
So, here’s passing, rushing and scoring offense and defense – you will note that in the parentheses, you can see how each is expressed.
Some items of note here:
- “Indiana Syndrome”; ostensibly prolific offense and a defense that is just north of non-existent
- Purdue is the only team that is, on average, giving up more points than it gets
- Purdue would also be a fun game if we played them, looking at their rushing defense
- Penn State probably would get more passing yard if Hackenburg were standing
- Minnesota gets close to 350 yards per game on offense, and yet…
- Michigan State’s passing defense average so far remembers Oregon well
How is Michigan doing though? Well, you can see clearly that the strength of this team is turning out to be the defense, but that’s what we expected anyway. What is nice also is seeing 185 yards of rushing offense on average per game so far (three games, sample size, grumble grumble). It has been a while, and even if it continues to work, albeit at a slower pace in conference play, we should do well enough.
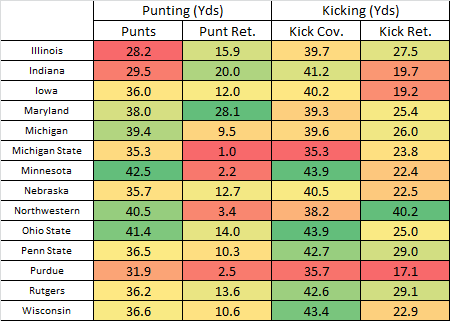
Here are some special teams numbers:
One thing to note here is that kick coverage is affected by touchbacks, so this is average net shown here. Michigan is close to 40 yards here, which is pretty good despite being in “yellow” here. Much of that, as you can see, is due to some compression in those numbers. Kick returns average 26 yards for Michigan, and if you scan over to the punting numbers, the return game might stand some improvement, but overall there is some marked improvement in this part of the game too.
Also, 11 people on the field all the time. Weird, right?
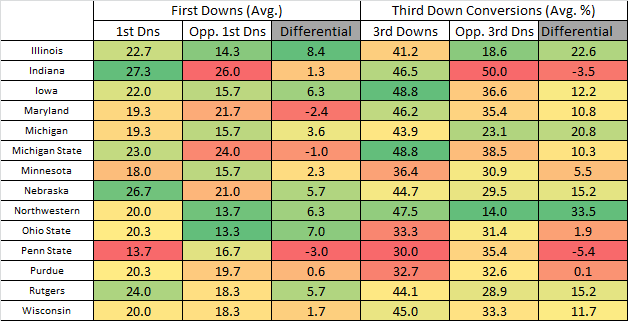
Here are first and third down numbers with differentials. This is more informational, but you get at least a little insight into who is moving the ball better and who is getting stops on a regular basis. Again, against some of the teams the Big Ten has played collectively, it only takes will power and a mean stare to prevent the other team from converting. That will change, as will these numbers, soon enough.
Michigan’s numbers are about what you would expect from watching the games – the offense works in fits and spurts sometimes, hence the “meh” first down numbers. On third downs, you can see the defense clicking rather loudly, if you will.
September 23rd, 2015 at 12:49 PM ^
Will power and a mean stare? Sounds like some teams are using the leer defense, and are about to go from this...

to this...

September 23rd, 2015 at 12:59 PM ^
What about this super mean stare?

September 23rd, 2015 at 6:50 PM ^
September 23rd, 2015 at 11:11 PM ^
September 23rd, 2015 at 1:23 PM ^
After all, all Illinois had to say to their directional brethren Western Illinois to get them to score exactly zero points was this (with just as intimidating a defense):

September 23rd, 2015 at 2:20 PM ^
I especially like the relative color coding and overall simplicity. Makes comparisons that much easier. Well done and please continue doing it!
September 23rd, 2015 at 3:04 PM ^
Michigan State’s passing defense average so far remembers Oregon well
Not sure I understand this statement. Western had 365 passing yards on MSU, Oregon had 309, and Air Force had 149 (on only 9 attempts which is 16.6 YPA).
September 23rd, 2015 at 3:13 PM ^
Probably an accidental omission - I actually wrote "WMU and Oregon" in the original notes (this was transcribed off a legal pad mostly, like most of my diaries written in the middle of the night). Larger point being, of course, that early on they've shown themselves to be vulnerable through the air.
September 23rd, 2015 at 3:18 PM ^
I'm surprised Michigan State's offensive rushing is so low...
September 23rd, 2015 at 4:26 PM ^
Wisconsin with red offensive rushing yards?
*edit* not just red but the worst?
September 24th, 2015 at 12:41 AM ^
which is not good considering two of their three games should have been pretty easy for a "playoff team". Ease of schedule most of the rest of the way may be the only thing that saves them.
I'm getting more optimistic about the MSU game if they don't look better in the next couple of games.
September 25th, 2015 at 8:58 AM ^
Just a thought.
September 24th, 2015 at 3:38 AM ^
Hi,
I like that color coding for passing, rushing and scoring offense and defence which is very simple and easy understanding.
Thanks
September 24th, 2015 at 9:41 AM ^
Great series. Thanks. I'm reading the Diaries more these days.
September 25th, 2015 at 6:04 AM ^


Comments