Mattison
[Ed: bump in case anyone doesn't know to read these yet.]
So, we're almost 3 quarters into the Brady Hoke era, and what have we learned? Not a hell of a whole of a lot. Western was a cupcake, and we provided the vanilla frosting, the vanilla defense, and the vanilla offense. There's plenty to criticize and the few good things all come with cupcake's caveats. Next week will be the real barometer of our progress .
Somewhere in the back of my self-important mind, I worry that breaking down our offensive and defensive systems might give a very tiny advantage to our opponents. So this year I'm going to do less system stuff and focus on individual plays and players when it comes to our team. I'll save system analysis for scouting reports of other teams.
But first, I just have to say:
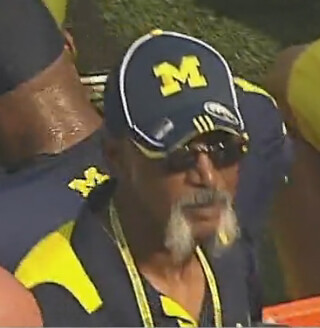
You sir, have an awesome mustache.
Let's start with the bad:
Their first drive was cause for concern. Just getting aligned was a problem on many plays.
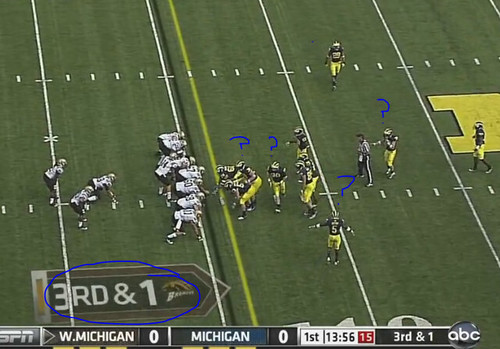
I'm pretty sure this isn't how you're supposed to defend a 3rd and 1.
And on this next play, the confusion is so thick, you can cut it with a knife. You could roll it into a batter and make... hmmmm... I'm hungry...
Despite being in a shotgun look, this is clearly a run formation. What's the giveaway?
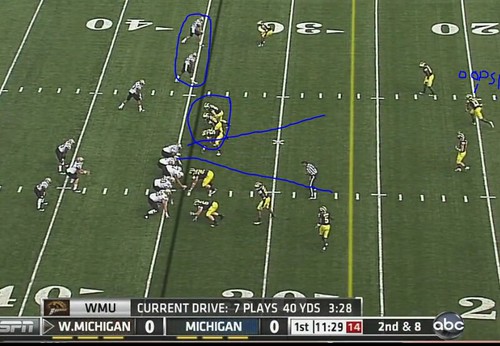
How about the covered slot "receiver" making this an unbalanced line. We've got 3 guys defending air, and the DB's are so far back, they're practically giftwrapping a 10 yard run.
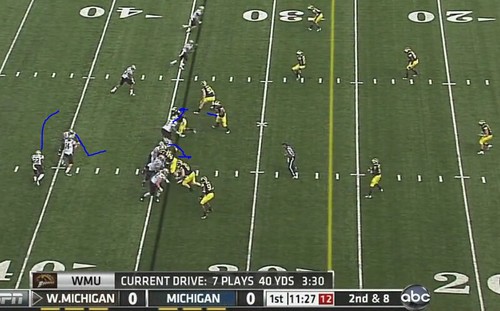
The QB meshes with the fullback to give an option look, and he wisely hands it off since our linebacker is way out of position.
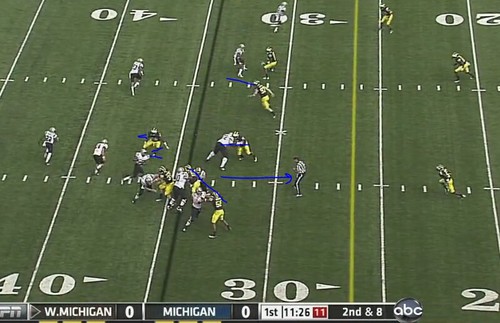
The ball carrier cuts back to the GAPING HOLE. Meanwhile, our contain guy is so concerned with both the QB and pitchman, neither of whom have the ball, that he can't make a play on the FB.
But I'm encouraged by the fact that we got it figured out before the drive was even over.
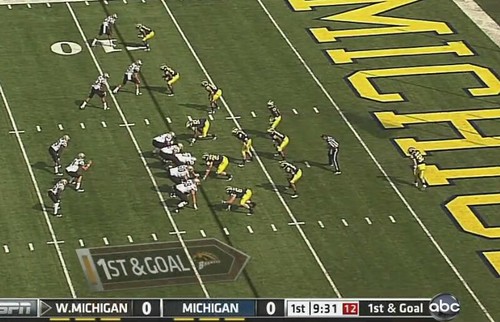
Here we are against the same exact formation and play a few downs later. That's a quick adjustment, or maybe it's just that nobody f'd up this time. Notice that the DB's are in a position to support against the run and we clog up the middle to stop the FB for practically no gain.
Carvin Johnson was misaligned on the next play, but Avery did a good job to make a solid tackle and delay the TD. But as a whole, the defense looked like most of them have had 3 or 4 different coordinators in the last 4 years.
I'm also concerned about the size of our front seven, and when we go against the likes of MSU, Neb, OSU, and god willing - Wiscy, well.... let's just hope things get better.
[Ed.: more after the jump.]
61