gold star diaries
[Ed.: Many excellent diaries of late that all but demand bumps. Larsonlo's Football Fundamentals 101 series is a must-read that will hit the front page at some point and the Mathlete's back, plus Misopogon is analyzing Cam Gordon in crushingly detailed fashion. Here's a quick one that hints at the QB duel winner.]
The quarterback is obviously the single most important position in Rich Rodriguez's offense, so I decided to take a look at some numbers from his time at West Virginia up until this past season at Michigan. What I found, while not exactly scientific, is pretty damn interesting.
Before I get to the summary, let's take a look at the charts... [ed: charts.]
West Virginia QB Charts
|
Year
|
Record
|
Player
|
Passing
|
Rushing
|
QB Rush%
|
Rush % Total
QB yds
|
Total Team
Offense Rush %
|
|
2001
|
3-8 (1-6)
|
Brad
Lewis
|
135/237
1,339yds
7TDs, 9INTs
|
54att,
41yds,
1 TD
|
18.6%
|
2.97%
|
52.4%
1,992 Rushing
1,811 Passing
|
|
2002
|
9-4 (6-1)
|
Rasheed
Marshall
|
139/259
1,616yds
9TDs, 5 INTs
|
173att,
666yds,
13 TDs
|
40.0%
|
29.2%
|
67.8%
3,687 Rushing
1,753 Passing
|
|
2003
|
8-5 (6-1)
|
Rasheed
Marshall
|
109/215
1,729yds
15 TDs, 8 INTs
|
101att,
303yds,
4 TDs
|
32.0%
|
14.9%
|
57.6%
2,762 Rushing
2,034 Passing
|
|
2004
|
8-4 (4-2)
|
Rasheed
Marshall
|
144/242
1,886yds
19 TDs, 9 INTs
|
169att,
861yds,
4 TDs
|
41.0%
|
31.3%
|
60.4%
3,034 Rushing
1,993 Passing
|
|
2005
|
11-1 (7-0)
|
Pat White
|
65/114
828yds
8 TDs, 5 INTs
|
131att,
952yds,
7 TDs
|
53.4%
|
53.5%
|
73.2%
3,269 Rushing
1,398 Passing
|
|
2006
|
11-2 (5-2)
|
Pat White
|
118/179
1,655yds
13 TDs, 7 INTs
|
165att,
1,219yds,
18 TDs
|
47.9%
|
42.4%
|
65.7%
3,939 Rushing
2,059 Passing
|
|
2007
|
11-2 (5-2)
|
Pat White
|
144/216
1,724yds
14 TDs, 4 INTs
|
197att,
1,335yds
14 TDs
|
47.7%
|
43.6%
|
65.1%
3,864 Rushing
2,067 Passing
|
Michigan QB Charts
|
Year
|
Record
|
Player
|
Passing
|
Rushing
|
QB Rush %
|
Rush % Total
QB yds
|
Total Team
Offense Rush %
|
|
2008
|
3-9 (2-6)
|
Steven
Sheridan
|
165/338
1,718yds
11 TDs, 12 INTs
|
118att,
293yds,
3 TDs
|
25.9%
|
14.6%
|
50.8%
1,771 Rushing
1,718 Passing
|
|
2009
|
5-7 (1-7)
|
Denard
Forcier
|
179/312
2,233yds
15 TDs, 14 INTs
|
187att,
591yds,
8 TDs
|
37.5%
|
21.0%
|
48.4%
2,234 Rushing
2,380 Passing
|
|
Year
|
Rush %
Total QB Yards
|
Record
|
| 2005 | 53.5% | 11-1 (7-0) |
| 2007 | 43.6% | 11-2 (5-2) |
| 2006 | 42.4% | 11-2 (5-2) |
| 2004 | 31.3% | 8-4 (4-2) |
| 2002 | 29.2% | 9-4 (6-1) |
| 2003 | 14.9% | 8-5 (6-1) |
| 2001 | 2.97% | 3-8 (1-6) |
Throwing the two seasons at Michigan into the mix wouldn't change much, either. The 2008 and 2009 campaigns would be two of the bottom four performances in terms of how many of the quarterback's yards came on the ground and two of the bottom three in terms of overall record.
Even beyond just the quarterback's performance in the offense, however, Rich Rod's offenses seem to thrive when the majority of the overall offense is primarily generated on the ground. From his last nine seasons:
|
Year
|
Total Team Offense Rush %
|
Record
|
|
2005
|
73.2%
|
11-1
(7-0)
|
|
2002
|
67.8%
|
9-4
(6-1)
|
|
2006
|
65.7%
|
11-2
(5-2)
|
|
2007
|
65.1%
|
11-2
(5-2)
|
|
2004
|
60.4%
|
8-4
(4-2)
|
|
2003
|
57.6%
|
8-5
(6-1)
|
|
2001
|
52.4%
|
3-8
(1-6)
|
|
2008
|
50.8%
|
3-9
(2-6)
|
|
2009
|
48.4%
|
5-7
(1-7)
|
And these aren't even necessarily based on the quality of the team. If this was ranked on team total rushing yards it would make sense that more yards would generally be correlated to a better record, but these are rushing percentages compared to the rest of the offense on a year-by-year basis, comparing one aspect of the team to another aspect of the same team.
Very interesting findings, if you ask me. Findings that point to Denard Robinson being the ticket to the promised land? Maybe. Clearly Rich Rodriguez's offense flourishes with a quarterback that can run, and run often. His best team had 73% of their total offense come on the ground. Its quarterback ran for 125 more yards than he passed for. Sounds like Denard to me.
Also notice that after White's first season--in which passing was sporadic and the team was heavily reliant on his rushing offense--his passing stats took off. As Denard's passing game develops, his rushing options will open up more, and as Steve Slaton got to experience, this opens the door for an unbelievable rushing attack from your running backs as well.
Agree? Disagree? Let me know what you see in these stats, or if they even matter to you at all. I look forward to hearing what you get out of these numbers. [Ed: /Ives.]
Thanks for reading,
CollegeFootball13
[ed: bump.]
Pulling the content a little closer to home this week in an effort to keep a higher R squared value with the MGoBlog readers!
As always, this analysis only considers games between two D1 opponents and takes only plays during competitive game situations into account.
Not all great offenses are created equally
If we are going to know what it takes to become a great offense under Rich Rodriguez, we must first know what it will look like, because great offenses can take on many different appearances. Below is a play success distribution for my top rated offense last year (Georgia Tech, option baby), the top passing offense (Captain Leach Texas Tech) and a look at West Virginia from 2007, Rodriguez’s last year at the helm. I went ahead and threw in the BCS’s worst, Washington St, just for comparison.
The Paul Johnson option is working with big plays, rather they are taking out the bad plays. Over three-quarters of Georgia Tech’s plays go for positive yardage. This balances out no strong tendency towards big plays. The end result is old school football: lots of long drives and moving the chains.
At the Captain’s helm, Texas Tech had nearly a quarter of all of their plays go for no gain. As always, there are tradeoffs. For Tech they came in the form of the 10-20 yard gain.
Under Rodriguez, West Virginia saw something different than either of those two. Even with a run-pass split close to Georgia Tech, the distribution of the spread 'n' shred was much different than the Option. Where the Yellowjackets saw a heavy dose of positive but small gains, the Mountaineers had a solid lead in everything from 4-20 yards. The end results where similar with both teams producing touchdown drives with regularity, but the path was much longer for Georgia Tech. West Virginia’s ability to get the somewhat big play allowed them to shorten drives, add possessions to the game and eliminate some of the variance through an increase in scoring chances.
How close are we?
As everyone knows, we are much closer coming in to this year than we were last year. Here is another chart to support that notion.
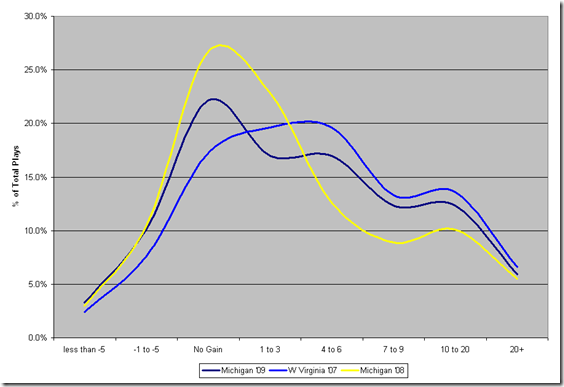 There are many charts to look at that show the dreadfulness of 2008, so we won’t dwell on that. What is becoming clear is that the shape of 2009 is becoming quite similar to West Virginia 2007. The big difference, and its a big one, is that Michigan still has a lot of plays going for no gain, where West Virginia was able to get 5+ yards out of those same plays.
If Michigan is going to mirror the West Virginia offensive success, it appears to have a made very clear first step last season.
How does this compare to previous years?
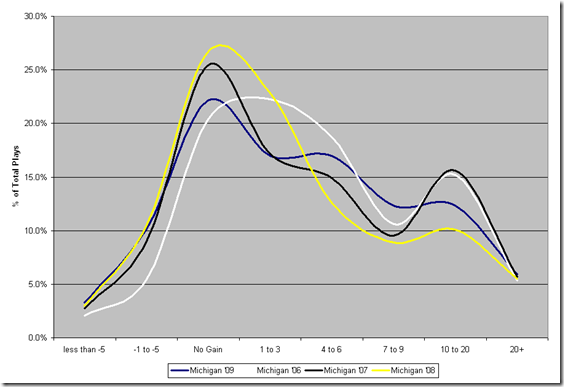 The biggest difference between the Carr era and the Rodriguez era in terms of yardage gained distribution is the passing game bump from the Carr era in the 10-20 yard gain range. The Rodriguez system is more geared towards to the 4-9 yard gains where the Carr offense excelled in the 0-3 and 10-20 yard ranges.
What does this mean for 2010?
The cliché: Take the Next Step.
It looks like framework of what Rodriguez wants to do is in place after two rough years, but the execution is still behind his days at West Virginia. The offensive line now has two years in the system and for the first time there is a quarterback (in fact two!) who have both experience and talent. As I noted in a previous diary, a jump from average in 2009 to good in 2010 is certainly a good possibility and with a break or two and improved quarterback play, it could go from average to great.
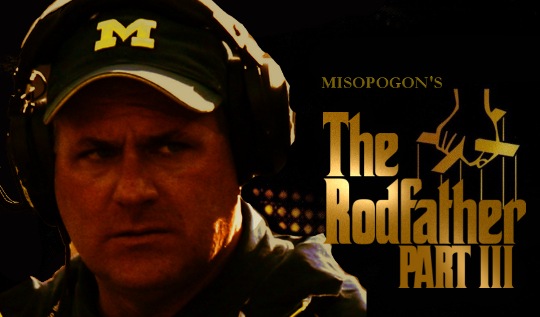
Why was I so feared, and you so loved? What was it? I was no less honorable. I wanted to do good. What betrayed me? My mind? My heart? Why do I condemn myself so? I swear, on the lives of my children: Give me a chance to redeem myself, and I will sin, no more.
If you have followed this series, you are now familiar with the message: light but focused recruiting plus really bad attrition equaled a defense with some really great players and some suicidal kittens.
Here's a question: based on recruiting and retention from 2006 to the present, how good will Michigan's defense be this year?
This diary will look at the talent on Michigan's roster in 2010 versus that of 2009, plus that of two rivals in that time, to try to get an idea of what kind of team we will be looking at this coming season.
In the first, we met the family.
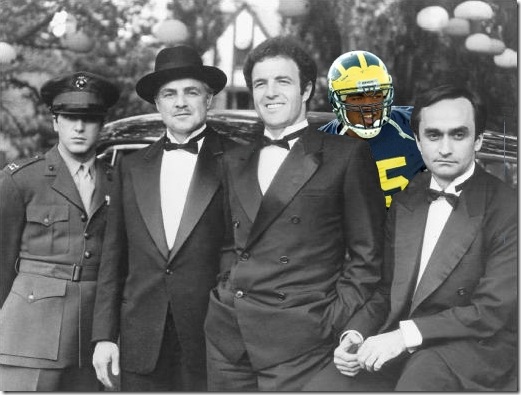
In the second, we saw that family destroyed.
Today, I bring you Part III.
You know, the one that's chronologically incompatible with the other two, with the substantially lower production values, that rehashes old characters and plotlines from the previous flicks in order to squeeze more cachet out of the franchise.
In the third (and final?) installment of the Decimated Defense Trilogy, I will look to the future, comparing Michigan's 2010 defensive roster and attrition numbers against those of last year, and also against 2009 and 2010 for two relevant rivals: Ohio State and Michigan State.
Still interested? [ED: YES YOU ARE.]

57