Charting Michigan's RB Carries Over Time Against Rutgers

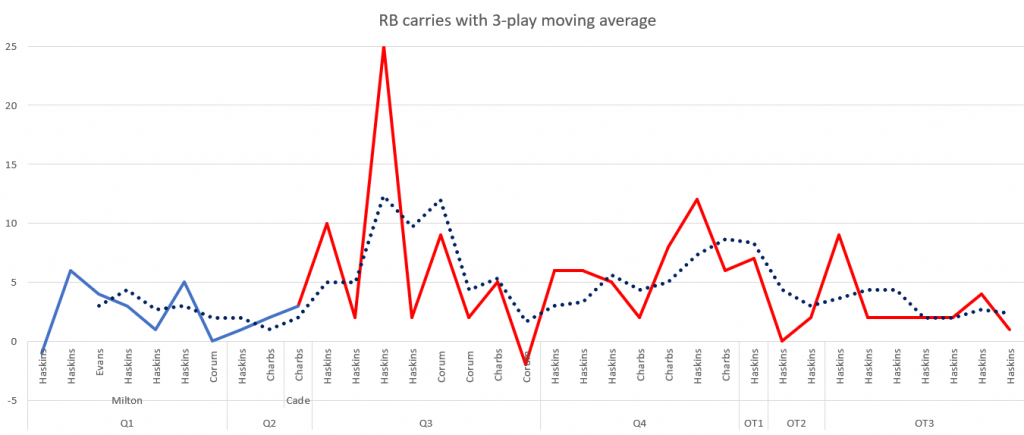
I was curious how much having a viable passing and RPO threat impacted the RB carries, so I decided to chart it. The blue line is when Milton was in and the red line is when Cade was in. The dashed line represents the three play moving average. Rutgers caveats apply, but the early results are pretty encouraging with Cade at QB.
November 22nd, 2020 at 3:56 PM ^
Again, when you have a quarterback in the game that can read defenses and complete passes to open receivers the defense can no longer stack the box and close off all running lanes. Yesterday was exhibit #1.
November 22nd, 2020 at 4:00 PM ^
When you hit easy slants, I imagine linebackers are more hesitant to attack the line.
November 22nd, 2020 at 4:02 PM ^
As hobbies go, this isn’t the worst I’ve seen, but still.
November 22nd, 2020 at 4:08 PM ^
It seems obvious to me that Cade is better at making quick receiver reads in progression than Joe. Definitely encouraging with Cade at the helm. Joe needs to work on his reads.
November 22nd, 2020 at 4:18 PM ^
Continues to beg the question, what were these two doing in practice that led to it being realized yesterday?? It is malpractice, embellishments intended.
November 22nd, 2020 at 4:19 PM ^
I get that coaches are hesitant to start freshmen for a number of reasons but man, the difference is night and day. When Cade is in the game, the offense looks like it did at the end of 2019. When Milton is in the game, it...doesn't.
November 22nd, 2020 at 4:29 PM ^
Perhaps Milton knows the Michigan defense scheme well and defenders weaknesses, he practices he may have a good idea what will be open presnap and throws with great claim and confidence. In games he has to make post snap reads and doesn't move through his progressions fast enough and accuracy and touch suffers.
November 22nd, 2020 at 4:29 PM ^
BTW Milton is only a couple of months older than McNamara. They both turn 21 next year.
November 22nd, 2020 at 4:42 PM ^
Good stuff.
I bet the defense would play better over time with good QB play as well.
November 22nd, 2020 at 9:33 PM ^
Good analysis - I think it’s fairly obvious. Cade can make post snap reads and Milton can’t or at least not yet. Makes a huge difference in everything.