Revisiting The AP Poll's Behavior Towards Michigan
REVISITING AP POLL BEHAVIOR: HOW MICHIGAN FARED
We’re quite used to following the polls week after week around here, but now that it has been about two months since I last did this and the regular season has come to an end, I thought it might be of some interest to revisit some of the trends in the AP poll voting.
SUMMARY TABLE:
|
TOTAL VOTES |
1233 |
|
AVERAGE RANK (ALL VOTES) |
3.973 |
|
MEDIAN |
3 |
|
MODE |
2 |
|
STD. DEV. |
2.221 |
|
VARIANCE |
4.933 |
|
HIGHEST VOTE |
1 |
|
LOWEST VOTE |
17 |
Even though we are #6 in the AP Poll right now, you can see from the summary statistics that we averaged higher in individual voting throughout the season, and that a good portion of those votes fell within a relatively narrow range of values. That would tend to speak to our performance being seen as extremely good overall, if nothing else, at least by the voters in the poll.
You will note from the graph of average rankings below that we reached our zenith in the ranking (#1) in the Week 13 poll on January 28th. At that point, we were 19-1, coming off the win against Illinois in Champaign. After this, of course, we went 6-5 for the remainder of the season, and you can see the steady decline save for a spike at Week 17, which was the February 25thpoll. At this point, we were 23-4 and coming off wins against Illinois and Penn State at Crisler. I was working visually off of the schedule to compile this (so hopefully the record week-to-week is accurate), but it should show give you an idea of the sensitivity of the poll’s results to our performance.
|
AP POLL WEEK |
WON |
LOST |
CHANGE IN AVG.FROM PREVIOUS WEEK |
|
1 |
Preseason |
0 |
|
|
2 |
1 |
0 |
0.26 |
|
3 |
3 |
0 |
0.94 |
|
4 |
5 |
0 |
0.51 |
|
5 |
7 |
0 |
0.71 |
|
6 |
9 |
0 |
0.01 |
|
7 |
11 |
0 |
1.18 |
|
8 |
12 |
0 |
0.12 |
|
9 |
13 |
0 |
-0.06 |
|
10 |
15 |
0 |
0.09 |
|
11 |
16 |
1 |
-2.12 |
|
12 |
18 |
1 |
1.91 |
|
13 |
19 |
1 |
1.10 |
|
14 |
20 |
2 |
-1.86 |
|
15 |
21 |
3 |
-0.95 |
|
16 |
22 |
4 |
-2.52 |
|
17 |
23 |
4 |
2.26 |
|
18 |
24 |
5 |
-2.63 |
|
19 |
25 |
6 |
-0.16 |
Not including the Preseason, of course, the remaining 18 weeks of polling saw 11 weeks where we experienced in upward movement in our average and 7 weeks of a downward turn. What is interesting here, of course, is that the average movement of, well, the average in the weeks of upward movement was 0.83, and the average downward turn was -1.47. I only did this calculation for Michigan, but it would be interesting to do the same analysis for other teams.
MORE DATA AND STUFF:
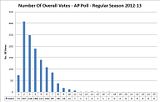
Here is what the total votes per rank looked like for us in the regular season -
It is interesting to see it this way - following the weeks in isolation, I don't think we get the sense of what this trend actually looks like, but it looks pretty good as the largest numbers of votes over the course of the season went to 2nd and 3rd place in the poll (if it were a running history and not a snapshot).
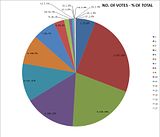
Here are the percentages of the grand total by poll ranking. As you'll see, nearly half of the votes cast for Michigan in 19 polls were for 2nd and 3rd place. Really, the same essential information as above, but a slightly different way to see how we stacked up across all the polls.
Here's the running average ranking for each week. Sadly, you can see February on this one, but considering that we maintained an overall average rank in the raw voting totals of 3.97, it doesn't seem as bad as it might look here.
Here are the weekly distributions in isolation. Apologies for the somewhat varied scaling on these.
Exhausting, I know.
IN SUMMARY:
As I mentioned, some of this has been seen on the blog before, but in isolation, like the weekly poll itself. The idea here was to take the whole body of data and see how Michigan fared in the entirety of the AP voting, and hopefully you agree that we did not do too badly for ourselves at all when looking at it like that.
Shouldn't you be focusing on your moderator duties?
(Great information, by the way)


Comments