The Luckiest Teams of 2012

going 12-0 is a often a recipe for this, but especially this year
With the pre-bowl season officially under wraps for 2012, it’s time for my annual review of teams whose record most greatly deviated from what it “should" have been.
To (attempt and fail to) avoid confusion, here is how I define Luck for this exercise.
What I Am Measuring
Luck can mean a lot of things but for this, I am comparing a team’s actual wins this year versus taking their opponent adjusted performance and re-simulating the season with the exact same schedule. Two teams who play a tightly contested game are roughly the same on that Saturday. Over a long horizon these wins and losses tend to even out but over a 12 game season there will always be teams whose final records don’t quite match how they played throughout the year.
What I Am Not Measuring
I am not looking at any preseason expectations. I am not looking at how each team did versus the recruits on their team. Those two would look at over-achieving teams of 2012 more than lucky. I am not going back to individual games or plays to look at if one or two games would have been different. I am also not looking at injuries on personnel changes throughout the year.
Think of this exercise as a sort of Pythagorean Wins for College Football. A lucky season is a great one to have for a fan, because no matter what the expected value is, the end result is all that matters in looking back. But like Pythagorean Wins, “Luck” is a great starting point for looking ahead. There are a lot of different ways to get to the same record. Last year Texas A&M had the most unlucky season in the country and was nearly 4 games below their performance. Kevin Sumlin did a great job this year and having the Heisman Trophy winner certainly helped, but Sumlin’s team was in a much better position than their prior year’s record would have indicated.
Teams with great records are rarely unlucky and vice versa. The formula is [Actual Wins] – [Simulated Wins]. If you win most all of your actual games there is very little room for your simulated wins to be higher. It’s more a factor of math than destiny.
2012 Results
Coach Hoke’s alma mater was 2012’s luckiest team. Ball State was simulated to win 6.4 games this year but pulled out a 9-3 record. Beyond that, three of the four teams following Ball State are of high interest to Wolverine fans.
| Team | Actual Wins | Simulated Wins |
| Ball St | 9 | 6.4 |
| Ohio St | 12 | 9.5 |
| Mississippi St | 8 | 5.8 |
| Notre Dame | 12 | 9.9 |
| South Carolina | 10 | 8.2 |
Michigan’s two biggest rivals and bowl opponent all crack the top 5. As noted above, Ohio St and Notre Dame were easy candidates for this list with perfect seasons, but their perfect seasons were the luckiest undefeated seasons in the seven years I have been measuring the luck factor, and by a considerable margin.
Michigan ended the season slightly lucky with 8 wins versus an expected 7.6 based on their total season performance.
Of the teams that finished the year with 2 or fewer losses, Florida State is the only team to finished at least 0.5 games unlucky, thanks to their upset to NC State and an otherwise weak ACC schedule. Their loss to the Wolfpack was the 7th most unlikely outcome of the season based on the simulation but the most likely outcome based on Seminole history. Of the Top 10 biggest upsets looking back, five happened in Week 1 and all by road teams (Youngstown over Pitt, McNeese St over Middle Tennessee, Tennessee-Martin over Memphis, Ohio over Penn St and Iowa over Northern Illinois). Only three of the top 10 happened after the second week of the season with UMass topping Western Michigan and Florida Atlantic over Western Kentucky joined the NC St upset. The Ohio-Penn St game was an interesting one because people acted like it was at the beginning of the season even though it really wasn’t at the time. By the end of the season Ohio had tailspinned and Penn St turned out to be a much better team.
The unlucky list features some of the same teams from the biggest upsets above
| Team | Actual Wins | Simulated Wins |
| Memphis | 4 | 6.9 |
| UNLV | 2 | 4.6 |
| W Michigan |
|
5.4 |
| Oklahoma St | 7 | 9.3 |
| Pittsburgh | 6 | 8.2 |
Michigan State was a few spots down, as they finished nearly 2 games below their simulated totals, falling on the wrong side a few too many 16-13 totals.
Is This Luck Repeatable?
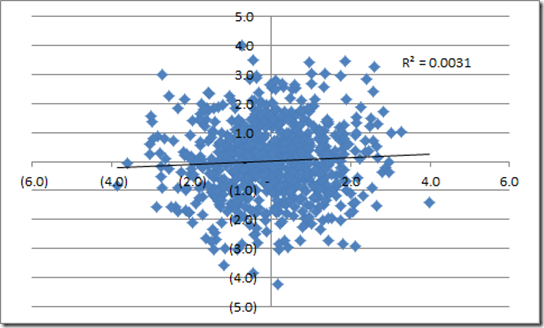
Almost certainly not. The scatter plot of current year versus prior year luck:
There are a lot of teams in each of those quadrants, each season is its own animal. Notre Dame’s was nearly 2 games above simulated this year but was –5.5 over the last three. Those who remember Northwestern as the team continually defying expectations. The Wildcats continued this year and are one of only two teams (Rice) who have had above average luck for all seven years. With Wake Forest right behind them I began started to draft a “smart schools are more lucky” section until I looked at the rest of the all-time top 10 and saw Middle Tennessee, Kentucky, Auburn and Ball State all on the list.
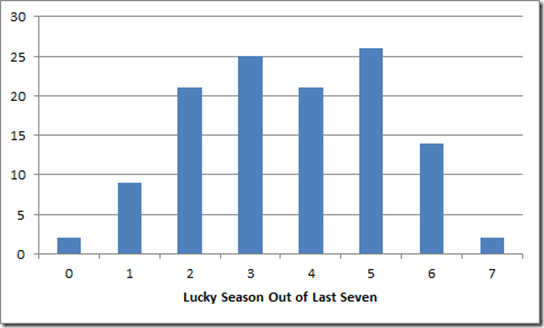
When you look at the spread of lucky years by
Count of teams by number of lucky seasons from 2006-2012
The twin peaks could mean there is a lucky and unlucky group, each normally distributed. It could also just a be bump in the data or it could be part of the fact that wins by program is somewhat consistent and luck is slanted if you are at one end of the spectrum. My biggest conclusion is that most of it is truly luck but that there is the possibility that teams like Northwestern or coaches like Les Miles have a true ability to consistently win more than they should but also that statistically, teams like that are bound to turn up even if its truly random.


Comments