A Hoops Season In The Books: A Statistical Summary

Now that college basketball’s latest season is officially in the books and we look forward to what we can expect from the season ahead, it might be a good time to take a look at the entire body of work for Michigan basketball.
It was a bit disappointing to be watching the final weekend of play in the tournament and not have a dog in the fight, as they say. Watching the National Championship game, I was more interested in the now-viral e-mail sent by Connecticut’s least favorite RA at points as opposed to the game, but I did watch.
Michigan did have a very good season overall by the numbers, of course. If you go by TeamRankings’ numbers, we ended the season with the 5thbest offensive efficiency, the 7thbest assist / turnover ratio, the 4thbest three point percentage and the 8thbest effective field goal percentage, not to mention finishing in the first quartile of Division I in several other statistics. We can be disappointed with the ending, but it was a productive year in which we ran away with the Big Ten, more or less. That definitely counts for a lot.
Let’s look at the overall summary:
|
WHOLE SEASON |
MICHIGAN |
OPPONENT |
|
Field Goal % |
47.84% |
44.57% |
|
Three Point % |
40.09% |
32.64% |
|
Effective FG% |
55.95% |
49.54% |
|
Free Throw % |
75.56% |
72.77% |
|
Off. Rebound % |
28.74% |
30.32% |
|
Def. Rebound % |
69.68% |
71.26% |
|
Assist / Turnover Ratio |
1.74 |
1.29 |
|
True Shooting % |
60.15% |
52.97% |
|
Free Throw Rate |
35.11% |
26.93% |
|
Possessions |
61.44 |
61.87 |
|
Points / Possession |
1.21 |
1.05 |
|
Turnover % |
13.12% |
14.92% |
|
Points |
75.53 |
65.20 |
I would think that, if we looked at the defensive (opponent) numbers, we probably would repeat something a lot of us said most of the year and say that it is what it is. However, there is something we excelled at in those figures – that 26.93% free throw rate is close to the top of Division I. If don’t follow this stat, it measures how many FT attempts you or your opponent make as a function of how many FG attempts you have. In other words, we didn’t allow teams to get to the line all that much, and it helped us out in many ways.
Here are the conference-only numbers:
|
IN CONFERENCE |
MICHIGAN |
OPPONENT |
|
Field Goal % |
48.94% |
45.82% |
|
Three Point % |
40.65% |
31.92% |
|
Effective FG% |
56.69% |
51.29% |
|
Free Throw % |
76.85% |
73.24% |
|
Off. Rebound % |
27.02% |
29.61% |
|
Def. Rebound % |
70.39% |
72.98% |
|
Assist / Turnover Ratio |
1.68 |
1.45 |
|
True Shooting % |
61.30% |
54.87% |
|
Free Throw Rate |
36.87% |
29.71% |
|
Possessions |
60.74 |
61.21 |
|
Points / Possession |
1.20 |
1.08 |
|
Turnover % |
13.64% |
14.71% |
|
Points |
72.53 |
65.53 |
Here are the out-of-conference numbers:
|
OUT OF CONFERENCE |
MICHIGAN |
OPPONENT |
|
Field Goal % |
47.09% |
41.97% |
|
Three Point % |
37.92% |
35.20% |
|
Effective FG% |
54.90% |
46.96% |
|
Free Throw % |
73.33% |
71.86% |
|
Off. Rebound % |
31.62% |
25.64% |
|
Def. Rebound % |
74.36% |
68.38% |
|
Assist / Turnover Ratio |
1.90 |
1.06 |
|
True Shooting % |
58.96% |
50.50% |
|
Free Throw Rate |
35.84% |
25.93% |
|
Possessions |
65.03 |
65.12 |
|
Points / Possession |
1.22 |
0.97 |
|
Turnover % |
11.99% |
16.18% |
|
Points |
79.08 |
63.50 |
You’ve seen these two tables before if you’ve followed previous entries, but one of the things that I believe they illustrate is the relative consistency that Michigan had on display all year. The most significant increases between these two parts of the season are mostly on offense, which illustrates how Michigan actually got noticeably better as the season progressed. On average, however, turnover percentage jumped about 12% from 11.99% to 13.64%, and in a bit, you’ll be able to see where the spikes in this number occurred.
We’ve talked at length on the board about the two statistics that seemed to suffer the most as the season wore on. One of them is offensive rebounding percentage, which was at an average of 31.62% in the OOC schedule, but fell significantly to 27.02% in the conference schedule, which is nearly a 20% decrease. Another one that took a rather marked hit was our average A/T ration, which was nearing 2.00 for an average in the OOC schedule, but tumbled a bit to 1.68 in the conference schedule, or about a 13% drop. It makes sense though with the increase in average turnover percentage.
One more breakdown, table-style…if you are curious:
|
MICHIGAN IN… |
WINS |
LOSSES |
|
Field Goal % |
50.04% |
41.12% |
|
Three Point % |
42.94% |
30.44% |
|
Effective FG% |
58.95% |
46.70% |
|
Free Throw % |
74.95% |
76.04% |
|
Off. Rebound % |
28.57% |
30.08% |
|
Def. Rebound % |
72.61% |
59.45% |
|
Assist / Turnover Ratio |
2.01 |
0.97 |
|
True Shooting % |
62.77% |
51.80% |
|
Free Throw Rate |
36.16% |
31.32% |
|
Possessions |
61.29 |
62.25 |
|
Points / Possession |
1.26 |
1.04 |
|
Turnover % |
12.67% |
14.65% |
This particular breakdown is not terribly meaningful perhaps, the differences are interesting.
For the trends below, I took the four factors plus a couple others that some folks thought might be relevant. To keep it a little simpler, I didn’t include the in-game values, but I will respond with them if there is a demand for them as I did make different versions of each table.
The game-to-game trends for us on some select metrics...


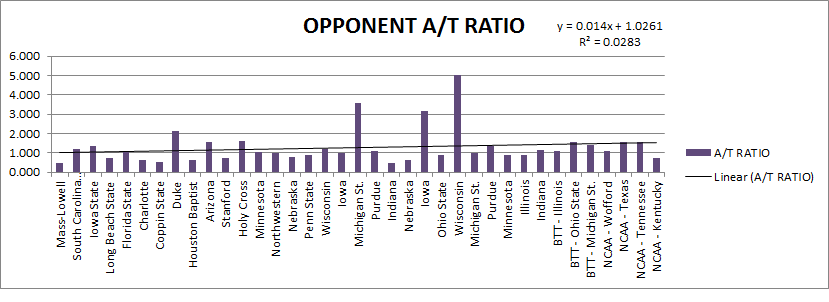
 For our opponents, the same metrics...


If there is anything else you would like to see, let me know.
April 10th, 2014 at 10:36 AM ^
These percentages are pretty close so it goes to show how the slightest edge can make such a big difference.
through traditional lenses. He stresses putting the ball in the basket with great shooters which means (on D) that teams don't get many runouts. He stresses (or has recently stressed) boxing out rather than rebounds for his big men, with the guards (all three of them) getting rebounds so that they can get runouts at the other end. And his teams don't foul. . . to an amazing extent, providing another 8-15 point defensive advantage.
Woud love to see someone with better knowledge of the game than I possess pick up this thread, because I am convinced there's something quite different going on here that renders routine D analysis a little less--maybe a lot less--useful in Beilein and Michigan's case. It's like he plays D from a different angle. Meantime, with a big man who can run like McGary in the middle, watch out.
April 13th, 2014 at 12:55 AM ^
If our offense is designed to prevent transition opportunities for our opponent, that makes our disappointing PPP on defense worse still.
Comments