2013 Turnover Analysis – Updated Thru MSU
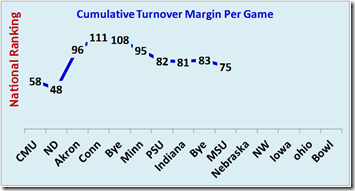
Synopsis: Michigan's TOM for the game was 0.0 for the second game in a row and for the year remains at – 2 (– 0.25 per game) which improved slightly to #75. Turnovers were not a primary factor in determining which team won the game but the interception by Ramon Taylor with 2:18 left in the third quarter with the score just 16-6 presented a golden opportunity. I was freezing my butt off in Spartan Stadium with the rain/sleet pelting me and was shocked that Dantonio was still throwing the ball so much. I figured the only way Michigan had a chance to come back would be through turnovers. I thought with the two score lead, Sparty would just run the ball and punt. But, Michigan could not do anything with the turnover and the Spartans dodged a bullet (16-13 would have been mighty interesting).
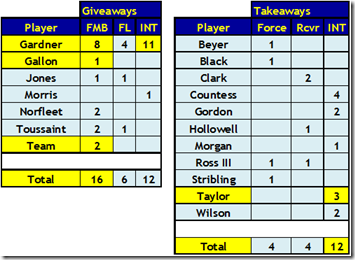
Gardner did throw an interception but, under the weather conditions, I expected more turnovers. Gardner, Gallon, and the Team (that horrible snap) all had fumbles but all were recovered by Michigan. The Spartans did not have a fumble.
Michigan had 12 giveaways in the first 4 games and has cut that in half in the last 4 games with just 6 giveaways.
For the year, Michigan and Nebraska are virtually identical for turnovers. Nebraska has 2.0 giveaways per game ranked #82 and 1.70 takeaways per game ranked #55 with a –0.30 TOM per game ranked #81. But, Nebraska is –2.0 TOM for the last 3 games and is –1.5 TOM for away games. Michigan has a 0.0 TOM for home games and has a +0.3 TOM for the last 3 games.
 Player Details: Here is the overall summary for all games by player (data in yellow was affected by this week's game).
 National Rankings: All rankings include games between two FBS teams ONLY and are from TeamRankings except for forced fumbles which is from CFBStats.
  The four columns with *** show the best correlation to offense and defense (per Advanced NFL stats).
 Turnovers And Winning: This chart shows turnover margin (TOM) at the end of the season versus the percentage of teams with a +4 WLM (8-4 record) or better. [WLM = Win/Loss Margin = Wins – Losses]
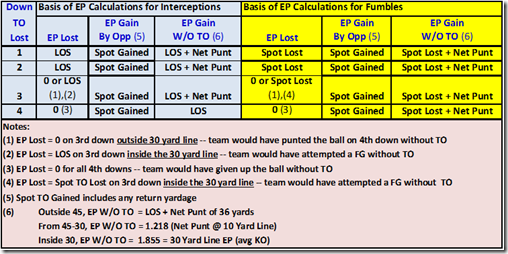
Expected Points: The impact of each turnover depends upon the down, the spot the turnover is lost, and the spot the turnover is gained. 
This chart shows Expected Points for various yard lines.
This chart shows the basis of EP calculations for each turnover.
November 5th, 2013 at 9:43 PM ^
It would be interesting to relate turnovers with QB sacks. Holding on to the ball instead of flinging it can lead to more sacks. Thanks for the work.
November 6th, 2013 at 6:17 PM ^
Michigan State had a fumble forced near the sideline, but Michigan players squirted it out of bounds as they tried to recover.


Comments