2012-13 Michigan Basketball: A High-Level Statistical Review Of The Team
2012-13 HOOPS: A HIGH-LEVEL STATISTICAL REVIEW
(NOTE: THE CHART THUMBNAILS ARE LINKED TO PHOTOBUCKET)
(OTHER NOTE: I HAVE MADE THE PIE CHARTS LARGER AND ADDED THE CATEGORY LABELS.)
Now that the season is slipping into history, I thought it might be appropriate to take a brief look at how our team fared statistically.
First, a rather broad Division I view:
Courtesy of TeamRankings.com (comprehensive rankings here), we can get some insight into where Michigan stood as a team in various areas when compared to the rest of Division I basketball. For example, there were a few areas in which we actually came out on top – our average of 9.4 turnovers per game and our 12.5% turnover percentage were in fact the best in Division I. Out foul statistics were equally impressive – 12.7 fouls per game and 16.9% foul percentage also amounts to a #1 finish in these categories. On defense, of course, this translated to Michigan being the best team in NOT sending people to the charity stripe, of course – on average, opponents went 8-12 from there against us.
As you might expect, we were typically a cut above on offense, and better than that, playing offense as a disciplined unit. Our 1.539 assist/turnover ratio speaks to that. We were also fifth in Division I in FGs made per game at an average of 27.8 as well as 9thin shooting percentage at 48.0% and 11thin effective field goal percentage at 54.4%. Our offensive efficiency came out to 1.135, good for 23rdin Division I basketball. Our 2-point percentage – 53.3% - was 9thoverall and our 3-point percentage – 37.7% was good for 29thamong the over 300 teams in Division I.
Second, onto us specifically:
When I started delving into the individual statistics for the Wolverines, what I found, as you would expect, are many stellar performances even from those who did not see all that many minutes on the floor. I have added a few statistics which are calculable from the team table to provide a little insight perhaps into how the team performed overall as well.
Here is what field goal percentages (straight FG percentage and effective FG percentage) looked like for everyone:
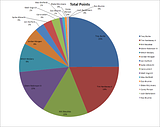
Obviously, as with most of these, the fewer attempts one made, the less meaningful the percentage would be because of sample size, but the contribution to the total effort should be noted all the same. You’ll note that, for most of the shooting –related charts, the green triangles here show the relative percentages. The pie chart above shows the relative contributions to Michigan’s grand total of points this season.
Here is three-point shooting for the year:
As you would expect, the best performance here among those who played substantial minutes was that of Nik Stauskas, but Spike Albrecht’s performance should never go unnoticed.
As for free throws:
Trey Burke and Nik Stauskas had the best overall performance here among starters, but yet again, for the few opportunities that he had, Spike made the most of his free throws, I would say.
Rebounding was interesting:
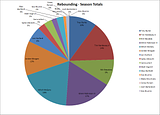
Glenn Robinson III and Mitch McGary factored heavily into our offensive rebounding, and Mitch and Tim Hardaway, Jr. came away with the most defensive rebounds. In the bar chart here, the green triangles are showing offensive rebound percentages, and the purple “X” is defensive rebounding percentage. The pie chart looks at contributions in terms of total rebounds.
Assists and turnovers tell an obvious tale, I would think:
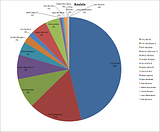
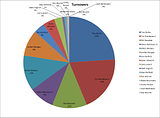
I put individual Assist/Turnover ratios here as well (green triangle). Here is part of the story of a disciplined team that works as a unit and rarely turns it over, and of course, at the head of it is Trey Burke. The pie charts here show the relative contributions across the season.
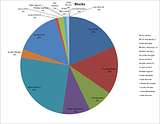
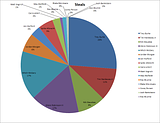
I went with the pie charts alone for blocks and steals so you could see how everyone contributed to Michigan’s defensive efforts at a high level:
TL;DR CONCLUSION:
Again, like many of these diaries, the conclusion is yours to make. Mine in summary is that we really did play like we belonged in that NC game.
OBLIGATORY:

April 11th, 2013 at 10:55 AM ^
this looks awesome, but can you increase the size of the charts in the article itself?
April 11th, 2013 at 12:20 PM ^
I previewed this with that in mind, but various items ended up being too small to read, so the thumbnail links to the full-size charts worked out better.
As for dmblue's comment below - I looked at this on a couple screens around the office, and you have a point. I am going to try to work on a fix for that later. My apologies on the colors.
April 11th, 2013 at 11:10 AM ^
Great post, but seriously all of those shades of blue look the same. The reds are hard to tell apart to. You have to use a better color scheme.
They'll almost certainly increase, because we'll have a new point guard. A year ago, Burke's assist:turnover ratio was about 1.5 to 1, whereas this year it was 3 to 1. We were decent at taking care of the ball in 2011-12, and then became off-the-charts good this year when Burke was experienced.
Albrecht and LeVert figure to be two of the primary ballhandlers next season, and by the numbers had better assist:turnover ratio than Trey Burke as a freshman.
Albrecht was almost 2:1 with 28 assists and 15 TO's
LeVert was even better, 2.5:1 with 25 assists and 10 TO's
Trey will be greatly missed in all areas, but I think ball security will probably be very good again next season.
It is amazing to watch the PG situation from last spring; Nobody to replace Trey if he bolted to the NBA, to the situation for next season; 3 viable alternatives to run PG in Caris LeVert, Spike Albrecht, and Derrick Walton.
Burke's contribution to the team is nicely illustrated on the pie charts. How many PG's have about 1/2 of their team's assists, lead their team in scoring, and add about 20% of the team's blocks. He is amazing and will be missed. It will be fun to see what next year brings.





Comments