Jimmystats: Starts by Class and Stars

Meta: Hokepoints is now alternating bi-weekly features. Jimmystats is the one where we play with Excel, H4 is the one where we play with Playmaker or get misty-eyed. Thank you readers who submitted name ideas.
Not all upperclassmen are good, but having upperclassmen is good. [Fuller]
I keep a few different databases on Michigan players for various uses, and Bosch's transfer initiated a two-day time sink into updating the big roster one. It now includes number of starts each guy since the 1993 class had in his career, along with the recruiting profile and career summary. Have at it, diarists:
Some stuff I generated with it:
The Holy Balls 2010 attrition chart:
Bigging it makes it clicker.
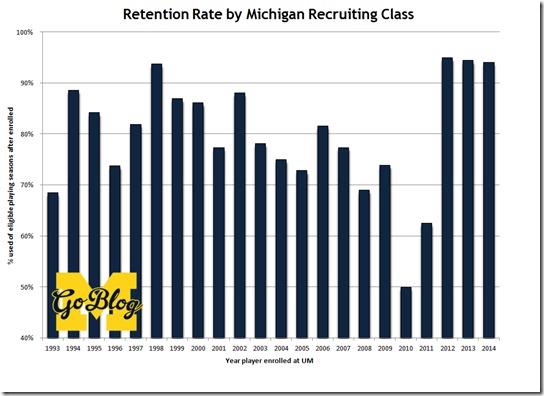
The retention rate isn't the number of players who stuck, it's the number of total eligible seasons the class would have produced if every freshman played four (and every junior transfer played two, etc.). If somebody ever says there was nothing good about the Hoke era, point at the 2012-2014 classes. I do expect the transition costs and other levies of time will reduce those triple towers eventually, but that is a very good start, especially the 2012 group who came in after 11-2 and got not that since.
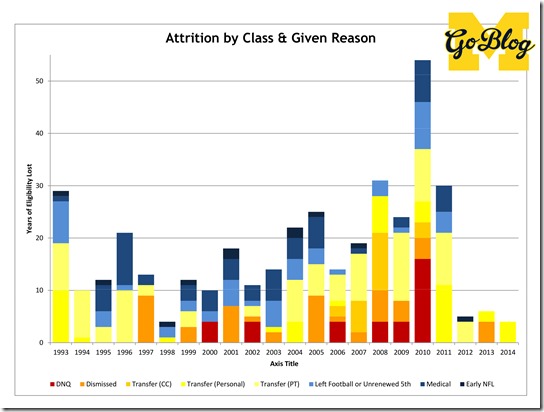
The flipside of course is that 2010 class, which spent exactly half of its eligibility not on Michigan's roster. And that was followed by the 2011 "process" class, which more on that in a minute. I also tracked the reasons for losses:
[Jump for that a bunch more charts and tables you can use to wow your friends, like the average number of starts for a 5-star recruit]
Cligging it makes it blickier.
I tried to use heat colors to show the level to which the coach and the program were at fault, with red and orange for years lost to recruiting guys who couldn't get in academically or were dismissed for behavioral things. Yellows are transfers of different varieties, and blues are the things you usually can't control, from those who left football to injuries and finally early NFL departures.
The 2011 class has just about everything to demonstrate why this chart isn't dead-on-balls accurate. Among those categorized as "personal transfers" are Chris Barnett, who didn't even make it to campus, Greg Brown who might have been playing time if you could believe Michigan had a cornerback depth chart before 2011, and Kellen Jones, who was injured. The class also "gave up football" Tony Posada, and zero lost years for Frank Clark even though his career summary lists him as "dismissed." Thomas Rawls, Chris Rock (NTCR), Tamani Carter, Chris Bryant, and Antonio Poole are the rest of the losses from the transition class.
Again: Brady Hoke's tenure in this regard is stark against Rodriguez. Only the Class of 1998 (shout out to my year!) had as little attrition as Hoke's classes. Unfortunately of the four dudes to not use up their eligibility in my class, three were consensus 5-stars: David Terrell went to the NFL early, Henson went to the Yankees, and Justin Fargas transferred to USC. The last was Dave Armstrong, an unrenewed 5th.
The 2013 Class is Just Young Chart
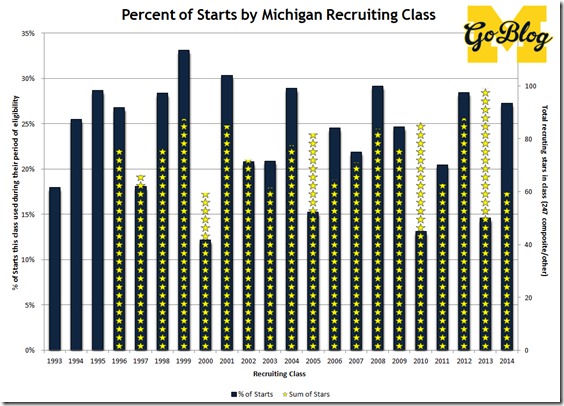
The blue bars are the percent of total starts that each class accounted for over (roughly) their course of eligibility. That is calculated as 1/4 times games their freshman year, 3/4 of games their fifth season, and 100% of the sophomore, junior, and senior years. Your expectations for a class should be they use about 25% of the starts over their tenure.
The classes with eligibility remaining aren't downgraded for games not played yet, but since starts tend to be weighted heavily toward the end of starters' careers, the 2013 class is very much on pace to produce more than its share of starts, even bracketed by two good classes.
I overlaid the start bars with total recruiting stars, a sum of the average stars given recruited members of the class. The average is of whatever Rivals, Scout, ESPN, 247, Lemming star rating I could find. Better classes did tend to produce more starts, but it wasn't exact at all. I can show that with the…
Table of Recruiting Star Power
| As Recruit | Players | Avg starts | RS as Fr | Avg lost yrs |
|---|---|---|---|---|
| ★★★★★ | 23 | 19.8 | 26% | 0.57 |
| ★★★★.5 | 34 | 15.7 | 66% | 0.76 |
| ★★★★ | 103 | 11.6 | 54% | 0.76 |
| ★★★.5 | 99 | 10.0 | 61% | 0.90 |
| ★★★ | 109 | 6.9 | 63% | 0.91 |
| ★★.5 | 25 | 9.8 | 71% | 0.84 |
| ★★ | 10 | 2.7 | 78% | 1.20 |
mouseover headers for explanation
Matt Hinton can thank me for that 3rd column when he's looking for yet another way to prove that recruiting rankings do matter. The average 5-star, in 3.4 seasons of eligibility, gave Michigan about 20 starts; it's half that once you're getting into the 4- and higher 3-star guys, and another drop-off for the two's. Also note the consensus 5-stars were far less likely to redshirt than other dudes.
It is therefore my recommendation that Harbaugh recruit as many 5-stars as possible.
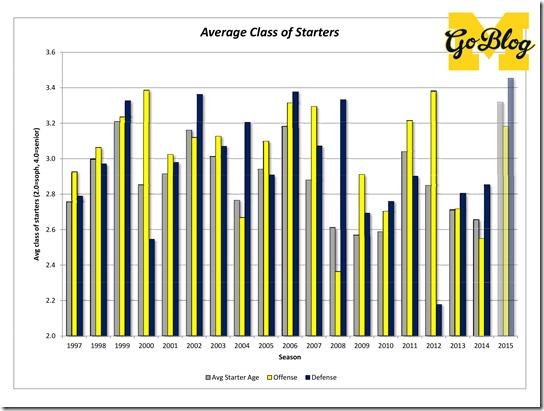
How Old the Starters Were:
ickingclay akesmay ityay iggerbay
UPDATE: There was a major error in the 2012 defense data here.
The above is the average eligibility of those who contributed starts. This is a total and divide thing; if a redshirt sophomore and a junior both started 13 games I had that as 13x2.0 + 13x3.0 divided by 26 = 2.5 average. Obvious redshirt problem is obvious, but it's still a fair enough representation of the relative experience of Michigan squads over the years.
For 2015 I showed the best possible scenario: if Morris, Green/Smith, Darboh, Chesson, Norfleet, Butt, Cole, Kalis, Miller, G.Glasgow, and Braden/Mags start all season on defense, and R.Glasgow, Henry, Taco, Ojemudia, Morgan, Bolden, Ross/Countess, J.Lewis, Peppers, Hill, and Wilson start all year on defense. That won't happen of course. Maybe for a future thing I'll look at what we expected going into the season versus what we're expecting, say, by next August.
Another thing you can see in the chart above is the tragedy and the excuse of the Hoke years. Excuse because the 2013 and 2014 teams and the 2012 defense were extraordinarily young. The tragedy because the offense in 2011 and 2012 should have been magnificent—minus some interior OL problems of course. It's further evidence that Hoke did most of the damage to himself by having Borges as his offensive coordinator, digging a hole his recruiting or his own coaching ability couldn't get him out of.
In table form:
| Season | DEFENSE | OFFENSE | Avg Starter | ||||||||
|---|---|---|---|---|---|---|---|---|---|---|---|
| Fr | So | Jr | Sr | Defense | Fr | So | Jr | Sr | Offense | ||
| 1997 | 1 | 56 | 45 | 30 | 2.79 | 26 | 12 | 40 | 54 | 2.92 | 2.76 |
| 1998 | 6 | 24 | 68 | 32 | 2.97 | 2 | 43 | 42 | 56 | 3.06 | 3.00 |
| 1999 | 10 | 16 | 27 | 79 | 3.33 | 1 | 22 | 54 | 55 | 3.23 | 3.21 |
| 2000 | 21 | 46 | 37 | 28 | 2.55 | 4 | 19 | 31 | 78 | 3.39 | 2.85 |
| 2001 | 7 | 22 | 70 | 33 | 2.98 | 2 | 44 | 34 | 51 | 3.02 | 2.91 |
| 2002 | 3 | 16 | 50 | 74 | 3.36 | 4 | 25 | 65 | 50 | 3.12 | 3.16 |
| 2003 | 9 | 25 | 44 | 52 | 3.07 | 2 | 42 | 35 | 64 | 3.13 | 3.01 |
| 2004 | 0 | 34 | 37 | 61 | 3.20 | 28 | 23 | 46 | 35 | 2.67 | 2.77 |
| 2005 | 7 | 22 | 77 | 24 | 2.91 | 4 | 36 | 35 | 57 | 3.10 | 2.94 |
| 2006 | 0 | 29 | 31 | 83 | 3.38 | 1 | 8 | 79 | 55 | 3.31 | 3.18 |
| 2007 | 10 | 18 | 66 | 48 | 3.07 | 21 | 13 | 12 | 97 | 3.29 | 2.88 |
| 2008 | 2 | 23 | 36 | 71 | 3.33 | 40 | 25 | 46 | 21 | 2.36 | 2.61 |
| 2009 | 23 | 36 | 33 | 41 | 2.69 | 7 | 44 | 35 | 46 | 2.91 | 2.57 |
| 2010 | 22 | 41 | 27 | 51 | 2.76 | 10 | 47 | 59 | 25 | 2.70 | 2.59 |
| 2011 | 24 | 14 | 57 | 48 | 2.90 | 0 | 34 | 42 | 64 | 3.21 | 3.04 |
| 2012 | 0 | 19 | 53 | 75 | 3.38 | ||||||
| 2013 | 7 | 54 | 42 | 40 | 2.80 | 31 | 33 | 22 | 55 | 2.72 | 2.71 |
| 2014 | 3 | 45 | 43 | 33 | 2.85 | 19 | 44 | 45 | 23 | 2.55 | 2.65 |
| 2015 | 13 | 0 | 65 | 65 | 3.27 | 0 | 13 | 91 | 39 | 3.18 | 3.32 |
January 7th, 2015 at 11:02 AM ^
Seth - you say Peppers is a projected starter on the 2015 defense but then in the chart you have a 0 for projected sophomore starts on defense???
January 7th, 2015 at 1:19 PM ^
January 7th, 2015 at 1:29 PM ^
for freshmen on the 2015 defense too. You projected starters for the 2015 are all upperclassmen.
January 7th, 2015 at 5:11 PM ^
Oops. That was all just done by hand so lemme fix.
January 7th, 2015 at 11:03 AM ^
January 7th, 2015 at 11:04 AM ^
Look at the DNQ's for that year. More than triple the number of any other year. That's why you don't try to bring guys to Michigan that "ain't come here to play school".
January 7th, 2015 at 11:19 AM ^
"It is therefore my recommendation that Harbaugh recruit as many 5-stars as possible."
January 7th, 2015 at 11:57 AM ^
on yet another outstanding creation. Your contributions are priceless.
January 7th, 2015 at 12:12 PM ^
I love numbers!
January 7th, 2015 at 12:37 PM ^
It's an industry term.
January 7th, 2015 at 12:54 PM ^
January 7th, 2015 at 1:19 PM ^
January 7th, 2015 at 3:13 PM ^
3.0 years avg years in the program seems to be the magic number. Only 2011, 2006, and 2003 are the most recent. Obvious outlier and Interesting that 1997 at 2.76 is one of the lowest
January 7th, 2015 at 3:31 PM ^

Comments