formations
My quick submission in the thread asking for backgrounds. jonvalk stepped up.
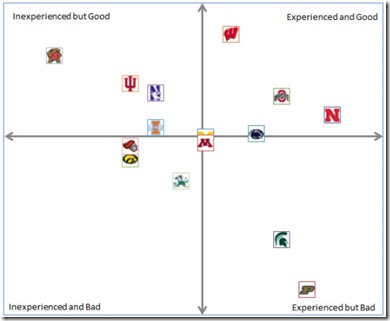
I think I made this same chart in 2008 #1: Gulo Gulo Luscus is joining Off-Tackle Empire and other folk in looking back at recruiting and OL development time to explain why the problems. His method is to look at average age of the starters versus the performance of the unit as measured by YPA/RPI. Cool chart:
If you can't find Michigan it's because we're buried under the Gophers. TSS's response should be part of the read.
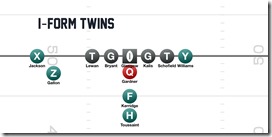
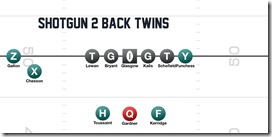
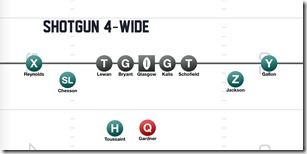
Ron Utah has the beginnings of his own UFR database. With Brian's permission I'll make mine available to anyone who asks for it—don't want to host it online but I'm willing to share copies if you say what you're going to do with it. Only concern there is those numbers are very much in context and the n's are quite small so it's easy to abuse. Anyway, Ron's thing tracked performance of different formations in the UConn game. Tiny sample sizes are going to hide most good info but we can whittle that down personnel instead of formation, since these two:
…have more in common with each other than either has with this:
. By personnel:
| Type | Runs | Rush YPA | Passes | Pass YPA | Total YPA | Pass% |
|---|---|---|---|---|---|---|
| Empty TE (1TE, 4WR) | 0 | - | 1 | 6.0 | 6.0 | 100.0% |
| 4-Wide | 0 | - | 5 | 6.8 | 6.8 | 100.0% |
| 3-Wide | 12 | 8.3 | 16 | 4.7 | 6.2 | 57.1% |
| Two TE | 11 | 4.5 | 8 | 0.1 | 2.7 | 42.1% |
| Two Backs | 5 | 2.2 | 2 | 1.0 | 1.9 | 28.6% |
| Big (2RB, 2TE) | 4 | -1.3 | 1 | 12.0 | 1.4 | 20.0% |
| Goal Line (2RB, 3TE*) | 3 | 6.7 | 0 | - | 6.7 | 0.0% |
| Total | 35 | 5.0 | 33 | 3.9 | 4.5 | 48.5% |
* Michigan brings in an OT (Magnuson) instead of a third tight end
Still too small a sample size . I'll check in the next bye week and see what these look like when we're not just zooming in on Gardner's terrible awful no good very bad day. The ratios look normal but given the relative paucity of plays with a fullback (and many of those probably in short situations) it's hard to judge those at all.
Goal line—6.7 YPA—we must be manballius!—looks great because of two Gardner boot-to-runs (it would be epically higher if he'd seen Funchess wide open downfield on one of them), but the other play from that formation was a near-crippling fumble-defensive TD.
On the other hand: 12 rushes for 8.3 YPA from three-wide is not a red herring: that is Gardner's rushing ability and the fact that Michigan is far better at getting linebackers out of the box by making them split out with a slot receiver than having a tight end forcibly remove him. Note when it counted on that late 4th and 2 they went with a 3-wide formation and let Gardner pick his spot.
Our Demographic. I made this to explain our numbers versus other media outlets to a potential advertiser:
She's probably on the phone with WTKA now.
[Jump.]
There was once a dream that was called Denard Robinson: Accurate Passer. You could only whisper it; anything more than a whisper and it would vanish…it was so fragile. And I fear that it will not survive the fall.
Last Saturday while watching Andrew Maxwell derf another derpity doo, I half-rhetorically asked the assembled a room full of Spartan fans who's the best passing quarterback in our conference this year. Answers, in order of appearance:
- …
- "CHHIIIRP CHIRRRP" –insects with that leg-rubbing noise
- …
- …
- "Howl" –wolf in the distance
- "How about that little dude on Northwestern?" – a Sparty
- "No he graduated." –another Sparty
- …
- "Shit. Really?" –first Sparty
After three weeks the stats (min=25 attempts) say it's Denard and ol' Tyranno-arm:
| Rk | Player | Team | Att | Cmp | Yds | Yds/Att | Ys/Gm | TDs | INTs | Rating |
|---|---|---|---|---|---|---|---|---|---|---|
| 1 | Denard Robinson | Mich | 75 | 41 | 699 | 9.3 | 233.0 | 6 | 4 | 146.3 |
| 2 | Taylor Martinez | Neb | 79 | 56 | 713 | 9.0 | 237.7 | 7 | 1 | 170.7 |
| 3 | MarQueis Gray | Minn | 44 | 26 | 398 | 9.0 | 132.7 | 5 | 169.2 | |
| 4 | Reilly O'Toole | Illini | 48 | 38 | 394 | 8.2 | 131.3 | 6 | 2 | 177.3 |
| 5 | Braxton Miller | OSU | 78 | 48 | 611 | 7.8 | 203.7 | 7 | 2 | 149.1 |
| 6 | Robert Marve | Pur | 56 | 41 | 414 | 7.4 | 207.0 | 4 | 156.7 | |
| 7 | Tre Roberson | Ind | 50 | 33 | 368 | 7.4 | 184.0 | 2 | 139.8 | |
| 8 | Cameron Coffman | Ind | 57 | 40 | 410 | 7.2 | 205.0 | 3 | 146.4 | |
| 9 | Matt McGloin | PSU | 104 | 59 | 688 | 6.6 | 229.3 | 8 | 1 | 133.5 |
| 10 | Danny O'Brien | Wis | 71 | 44 | 454 | 6.4 | 151.3 | 3 | 1 | 125.5 |
| 11 | Trevor Siemian | NW | 47 | 32 | 292 | 6.2 | 97.3 | 1 | 0 | 126.7 |
| 12 | Andrew Maxwell | MSU | 114 | 65 | 710 | 6.2 | 236.7 | 2 | 3 | 109.3 |
| 13 | James Vandenberg | Iowa | 103 | 59 | 593 | 5.8 | 197.7 | 0 | 2 | 101.8 |
| 14 | Kain Colter | NW | 56 | 37 | 321 | 5.7 | 107.0 | 2 | 0 | 124.9 |
| 15 | Caleb TerBush | Pur | 43 | 24 | 237 | 5.5 | 118.5 | 3 | 123.0 |
His interceptions are dragging down the passer rating, but half are explained by an accurate throw Vincent Smith deflected, and Roundtree getting shoved into last Tuesday by a Bama cornerback. It's just three games in, and the Big Ten competition this year isn't exactly the NFC South, but raise your hand if four weeks ago you thought there might be even a flimsy statistical case for saying "Denard is the best passer in the Big Ten right now."
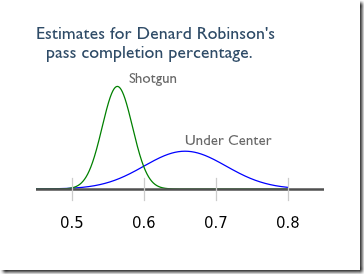
In last week's Mailbag article Brian remarked upon a Mike Rothstein study that claims Denard has been way more accurate under center than from the shotgun. The Power Rank made a chart:
We've been over his higher efficiency as a runner from the gun ad nauseum, and charted his regression last year as of December, but is he really a better passer when dropping back? Brian's suggested explanations were Pressure, Situation, or Luck (ie sample size). Let's dig into the UFR database and see if there's an answer.
[ROLL'D OUT AFTER THE JUMP]
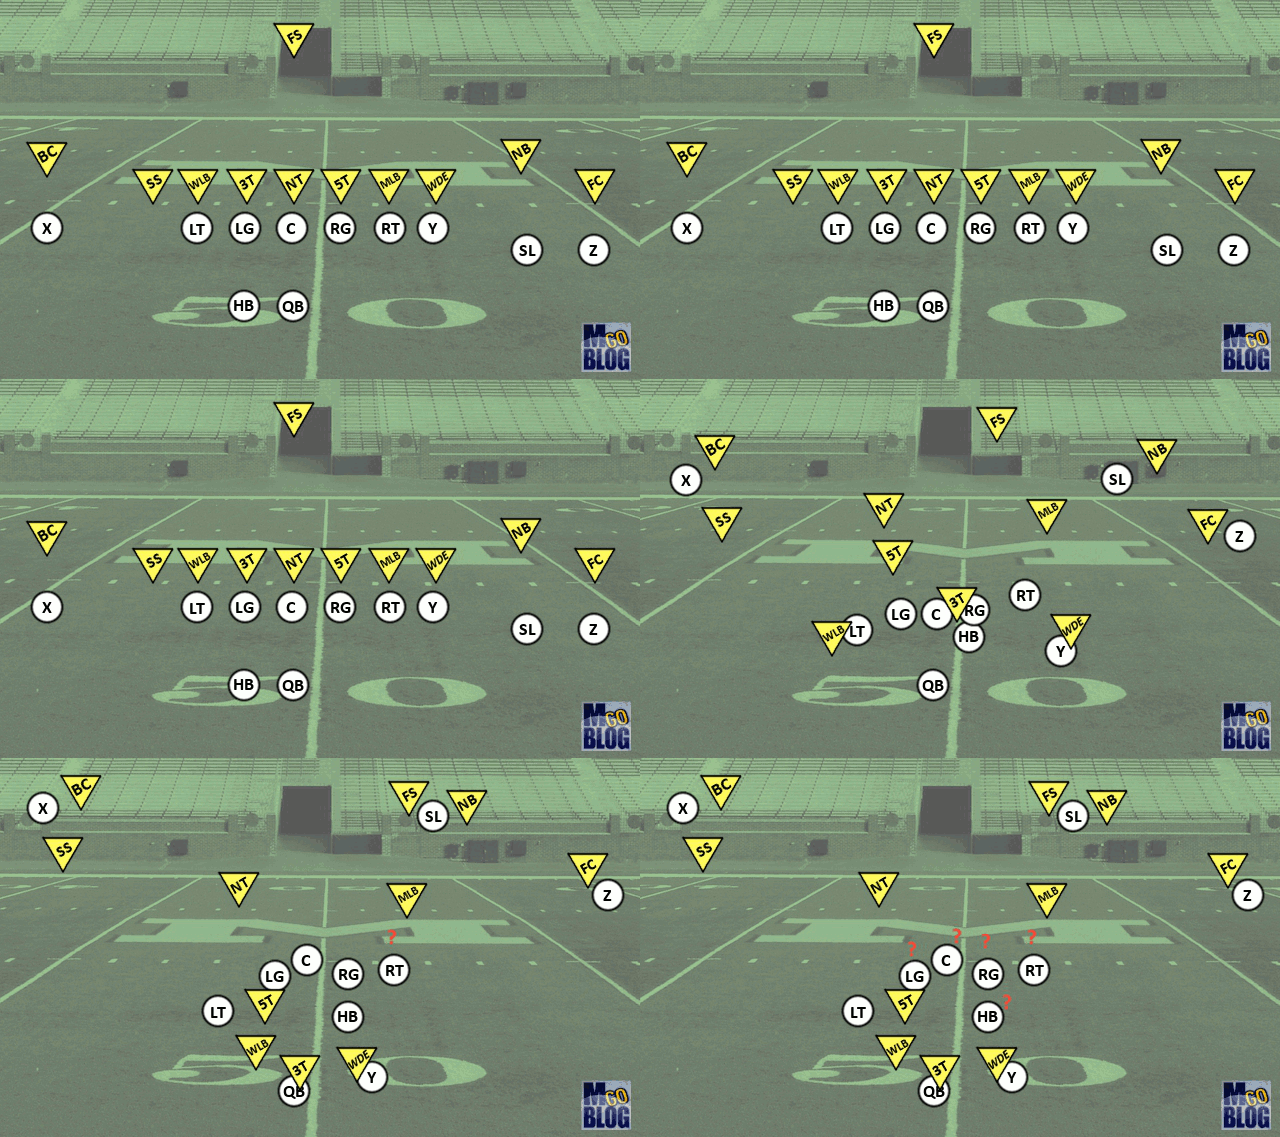
So I'm going to admit this: until kinda recently I didn't know what "Okie" was. I knew it had something to do with bringing a lot of guys to the line and then running the mother of all zone blitzes. Which is what it is, but not very specific. So I drew this out based on a play vs. Illinois last year, and this became the genesis of last week's 'Museday' (name changing), and a companion piece with drawings of various formations Michigan runs. I plan to make that a sticky for the rest of us who could use a reference occasionally, and fix any minor mistakes in the current pics (e.g. the 3-tech is misaligned slightly), so suggestions are welcome.
Turnovers are not random, just the random ones are. There's this disconnect still around these parts and others where the math says that turnovers are random—all coaches have their players drill loose balls and ball security with equal emphasis—and  significant deviation from the mean means you got lucky; and our lizard brains which say "that wasn't luck; that was Thomas Gordon being [high pitch] AWEsome."
So ZooWolverine, who wanted to believe he could find something—anything—to convince his brain it is not a lizard that sounds like a character from Friends, did his own stat study. The result: some skill involved in interceptions, but fumbles will still go 57-43 to the defense, and if you got something else it's luck. Sorry Joey lizard brain.
What do you get for a DUI? Getting behind the wheel of a car (or a golf cart) when intoxicated is really, really stupid. It's also scarily common, and college athletes seem to be particularly bad at this. There are degrees (one drink can put some people over the limit), but there's also enough of a record of coaches' responses to getting caught doing this stupid reckless thing that we have a fairly good idea of a typical DUI suspension. Gulo Gulo Luscus has updated that, and you can see my old list in the comments below. Findings: one game seems to be the going rate unless you play for Jim Tressel, and missing a practice season (spring, fall, etc.) is a little bit under average. Personally, not knowing the specific circumstances, I would want my coach to suspend the player for at least one game, always.
After THE JUMP the Diarist of the Week, the most awesome deck of cards ever, and Carl Grapentine says something that will give you goosebumps.


5