Offensive trends in the B1G, 2013

In a past diary, I charted Michigan's offensive trends over the course of the 2011-2013 seasons. In that diary, I relied on a statistic that I will call YPPdiv. This is equal to the offensive yards per play (YPP) in a given game, divided by the average YPP allowed by that team on defense. Thus, for example, Michigan averaged 7.35 YPP against Ohio State, a team that allows on average 5.01 YPP. So, 7.35 divided by 5.01 = a YPPdiv of 1.47.
Space Coyote suggested that I track the entire B1G over the course of the 2013 season to get a trendline for the entire B1G against which to compare Michigan (and each team's) offensive performance over time. Now that the regular season is over, it seemed like a good time to put the numbers together. Without further ado, here are the charts (click to embiggen):
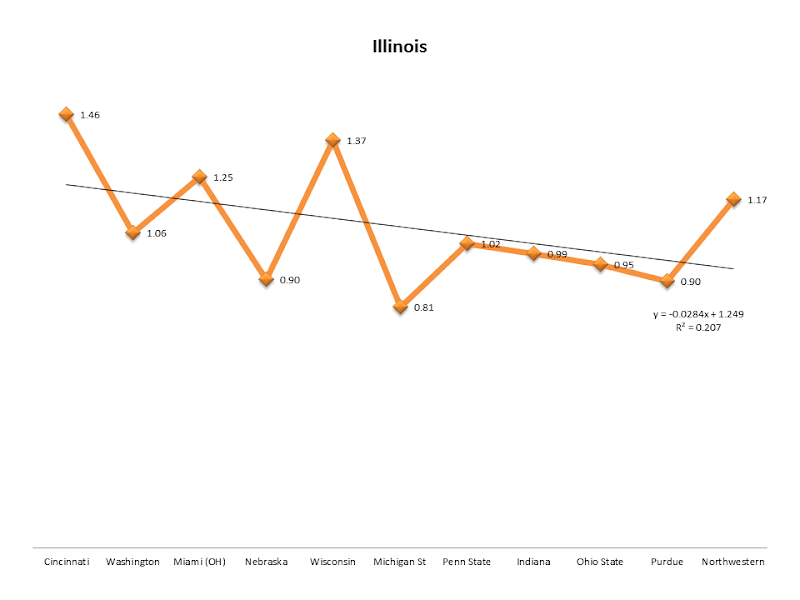
The story: Honestly I don't know. I think that Illinois might just be bad.
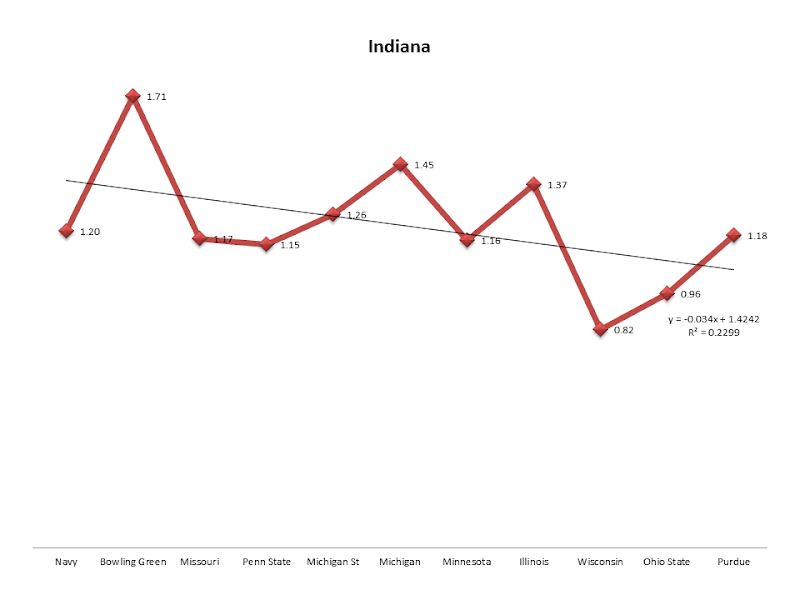
The story: Indiana ripped it up early in the year but didn't have much success against Wisconsin and Ohio State. I'm not sure why, and the Crimson Quarry blog didn't seem to have any good answers, either.
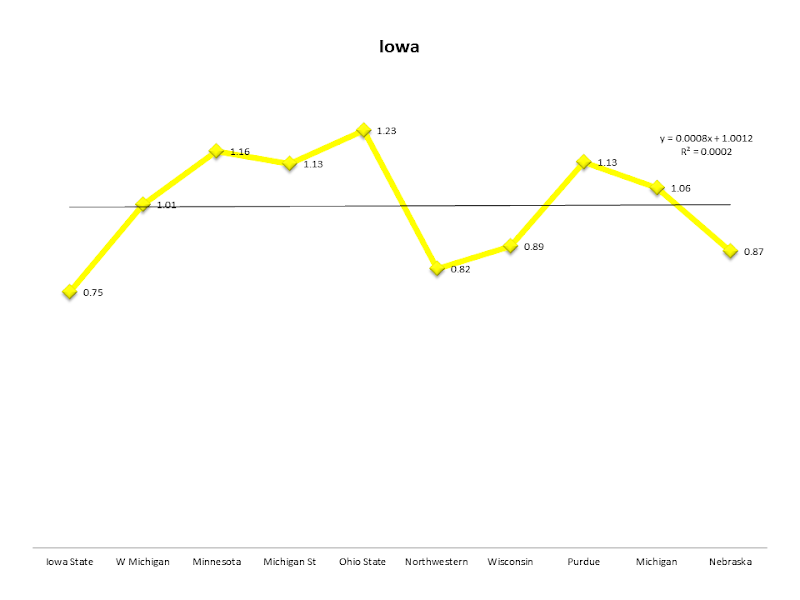
The story: Iowa was pretty Iowa all year.
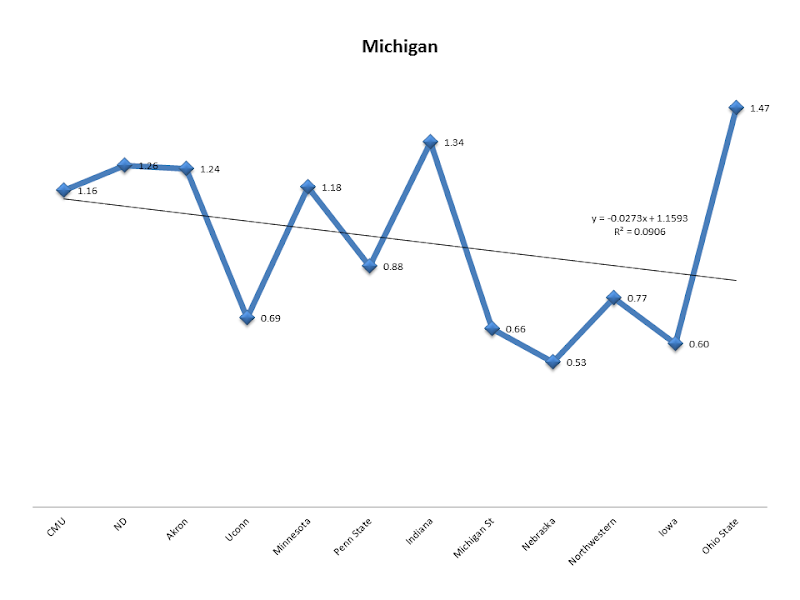
The story: problems with the offensive line, Devin Gardner being beaten up, complaints about the coaching. The Mathlete has proclaimed that this is the offense with the 4th highest standard deviation since 2003 (I'm not sure what stat he's using to calculate this; presumably it's PAN). But calculating the standard deviation of YPPdiv also yields a very high number for Michigan (0.33) compared to the rest of the B1G (an average of 0.21, with a high of 0.28).
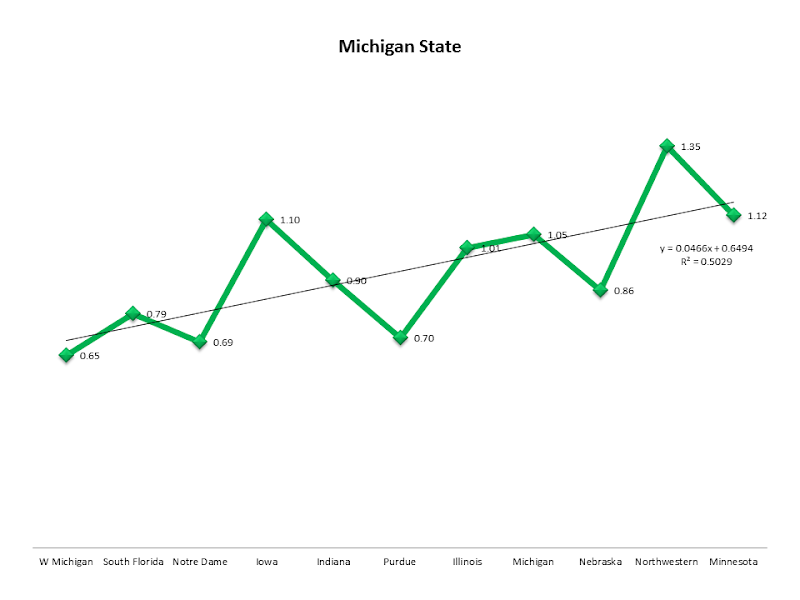
The story: Michigan State found an offense this year. Their first three games were awful, but they've shown clear improvement since then. Of course, they haven't played a really good defense, either.

The story: Minnesota is Minnesota. They like to run the ball.

The story: despite the many injuries to key offensive contributors, Nebraska managed to basically hold serve offensively. They ripped up MSU in yards per play, but they turned the ball over far too much.

The story: injuries to key offensive players, including Venric Mark, Kain Colter, and Tony Jones. There have also been complaints of conservative play calling.

The story: Ohio State's offense has improved over the course of the season. Between Miller and Hyde, the Ohio State offense has pounded away at their opposition, none of whom, it should be said, has a particularly great defense.
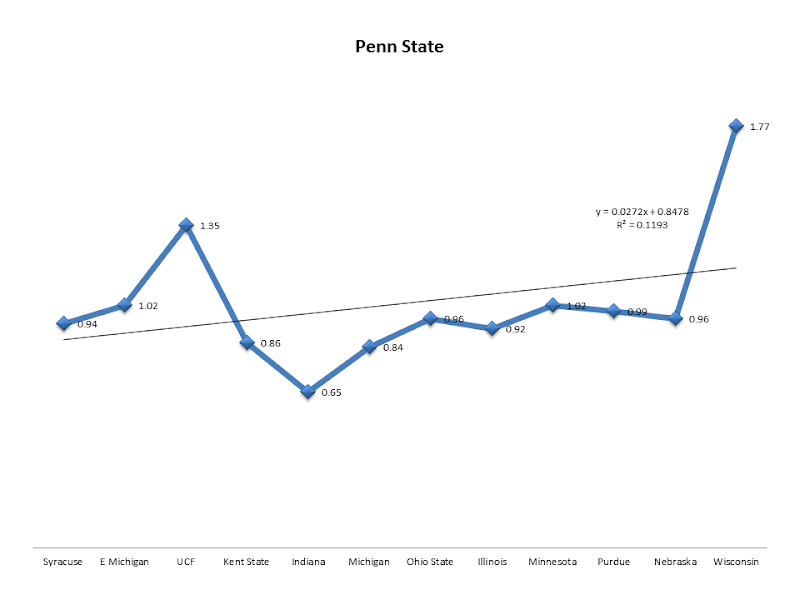
The story: Penn State played great against Wisconsin but has been sub-par most of the year on offense.

The story: Purdue is bad, and was mostly bad throughout the year. They're consistent, at least.

The story: Wisconsin's running game is fantastic, but Stave has been inconsistent.
So. The average offensive performance by B1G teams, week by week, is as follows:

Perhaps unsurprisingly, it's fairly flat, with consistent performances from one week to the next.
This suggests that an offense with a slightly negative slope isn't to be expected; we should perhaps expect a fairly consistent performance from week to week. This is something that Nebraska managed despite many injuries on the offensive side of the ball. The best teams in the B1G this year -- Ohio State and Michigan State -- both showed improvement on offense over the course of the year.
The Ohio State game taught us that Michigan's problem isn't a steady decline in offensive performance, but rather wild inconsistency due to youth and playcalling.
December 4th, 2013 at 12:33 PM ^
I think this is worthwhile to look at.
But hopefully not for the sake of putting Borges performance into context. We already had the context, Michigan and our expectations/requirements of a coordinator. We should strive to get better and definitely not get worse (barring injury or flukes ya know). Ohio State is a blip, but I have reasons for why we should get too much hope from that for reasons I won't explain now.
Now if you wanna put it into context look at the two teams who are in the B1G championship game, which is where we would like to be so this is close to the context of Michigan, their offenses improved. Borges be not a good OC and not worth the money. I feel like there are just too many data points showing that to be looking for reasons to keep him by justifying his performance compared to other sh*tty B1G teams.
Also, what is wrong with Wisconsin? Every time I've seen Stave I've loved him. Has he ever been the same since that injury took him out for a season?
December 4th, 2013 at 1:49 PM ^
DNak attack!
This is really helpful. Depressing, but informative. I was hoping that the downward slope would be consistent across all the BIG teams. I shudder to think of what your line would look like if we didn't go ham in the last game.
IME this is the issue to consider when debating the future of Gorgeous Al. I'm sure there are mitigating factors. The experience stuff I did suggests that youth probably plays a significant role, especially with our young interior line. Personnel is probably a big part of it too.
My main point: These mitigating factors influence season averages of things like YPP, YPC, YPA, and sack percentage when compared to other BIG teams. They shouldn't, however, play a role in determining the slope of the intraseason progress lines you're producing. If anything, we should expect to improve more than other programs over the course of a year because of our youth, since younger players can be expected to improve more than older players.
If I were Davey B., this is the thing I'd be looking at.* I don't care that our YPC this year was 3.07 and the BIG average was 4.5 (actually no clue). All I want to see is improvement. It's not like we're starting from an elite point where the only place to go is down. Unfortunately, I just don't see it with Alan "Al" Borges. I hope I'm wrong.
* I'm not Davey B., and even as Gandalf I have no control over the affairs of the athletic department. So this really doesn't matter. It's just the 16,000th opinion on the subject.
December 4th, 2013 at 7:01 PM ^
Considering our schedule was backloaded this year, I'm not sure you can draw much of a comparison from these charts, as teams played different schedules. I think a better comparison would be a chart showing offensive output against the same oponents, in BIG play.
December 6th, 2013 at 12:02 PM ^
December 6th, 2013 at 12:05 PM ^
Because those numbers aren't really fair either way.
December 6th, 2013 at 12:42 PM ^
I removed non-FBS teams -- I guess they're called FCS teams now? -- from the analysis.
December 6th, 2013 at 12:07 PM ^
It is different than I thought it was going to be. But it also makes sense in some ways. I agree with your conclusions, but in my opinion, would also add what I wrote on the Dear Diary post:
I also see in those charts an MSU game that really, really exposed a Michigan weakness, so much so that the next three teams went as far as to mimic what MSU did within their scheme (Nebraska to a degree, Northwestern as much as they could) or screw their typical scheme and just do something different (part Nebraska, totally Iowa). I think there is more proof of that, as after UConn, the next three games are pretty decent considering the compitition (even PSU is within reason). Then MSU comes and the bodies hit the floor as some hardcore rock guys would say.
OSU is an obvious outlier that is obvious. Also, it's always easier to revert to the mean. While I understand MSU did a bit more than that, as did UM, how you start the season will generally give some weight to the eventual slope.
I still liked the analysis and it was a bit different than I expected.
EDIT: Actually looking at the diary again, there seems to be a heavy dose of reverting to the mean outside of OSU (which just kept getting better). Illinois, Indiana, Michigan, and Wisconsin all started sky high and then dropped. MSU started like crap and came up to about average. PSU has a couple outliers but mostly stays relatively close to the mean. Northwestern actually does tank (injuries). Purdue is just bad. Then Nebraska, Minnesota, and Iowa all kind of started around the mean and finished around the mean.
So really, OSU is the big outlier here, in my opinion (though I thought the general trend would be a little more downward with non-con schedules than it turned out)."
December 9th, 2013 at 10:33 AM ^
Why is Big 10 football so boring? http://goemaw.com/forum/index.php?topic=30299.0
Comments