rebounding
[ed: bump.]
This diary was prompted by the debate from Tuesday between Brian and the Big Ten Geeks regarding the value of defensive rebounding. I read the Big Ten Geeks article that morning and had many of the same thoughts as Brian-I've never been a fan of the stops metric, particularly the way it was being used to compare players. As the debate moved to the value of defensive rebounding percentage, I decided to look through some Kenpom numbers to make a better argument for the importance/insignificance of that particular statistic.
| D-Eff Type | eFG% | TO% | DReb% | FT Rate | |
|---|---|---|---|---|---|
| 2013 | Raw | 0.86 | -0.39 | 0.46 | 0.17 |
| Adj | 0.82 | -0.33 | 0.49 | 0.18 | |
| 2012 | Raw | 0.86 | -0.39 | 0.40 | 0.15 |
| Adj | 0.78 | -0.28 | 0.43 | 0.23 | |
| 2011 | Raw | 0.84 | -0.37 | 0.43 | 0.15 |
| Adj | 0.77 | -0.18 | 0.48 | 0.28 | |
| 2010 | Raw | 0.84 | -0.39 | 0.42 | 0.17 |
| Adj | 0.76 | -0.19 | 0.44 | 0.28 |
A couple of notes. While I've labeled it as "DReb%", the statistic used was actually Opponent Offensive Rebounding %, hence the positive correlation with Defensive Efficiency (both statistics are "better" for the defense when the number is lower). TO% has a negative correlation because a higher TO% is "better" for the defense, so a high TO% would lead to a lower (read: better) defensive efficiency.
(It’s interesting to see how the Kenpom adjustments to efficiency change the numbers. eFG% and TO% consistently drop when adjusting for competition, while Dreb% and FTRate rise. The smaller deltas for this year makes me believe that this is a result of conference play and the leveling the playing field between teams that played non-conference schedules of varying difficulty, due to the relatively large proportion of non-conference game in the 2013 sample. I digress.)
It is well-known at this point that eFG% is by far the most important factor in defensive efficiency, but I was surprised that DReb% was the second most important factor (I had assumed it would be turnover rate). After seeing these results, I looked at the correlations between the four factors next.
| eFG% | TO% | DReb% | FTRate | |
|---|---|---|---|---|
| eFG% | 1 | 0.01 | 0.33 | 0.24 |
| TO% | x | 1 | 0.18 | 0.34 |
| DReb% | x | 1 | 0.13 | |
| FT Rate | x | x | x | 1 |
So, there is a weak, but significant (with >340 samples) correlation between eFG% and DReb%. Going back to the correlations with defensive efficiency, I ran a partial correlation between DReb% and adjusted defensive efficiency, controlling for eFG%, which produced a value of…0.41. About the same correlation as TO% (a partial correlation for TO% is almost exactly the same as one without the adjustment, as you’d anticipate based on the low correlation between TO% and eFG%).
It looks like defensive rebounding is at least as important as the non-eFG% factors. What about the effect on the offensive end? Like Brian, I believe that steals should be valued more than other defensive statistics, so I went in assuming that we’d see some sort of correlation between TO% and Offensive Efficiency.
| eFG% | TO% | DReb% | FTRate | |
|---|---|---|---|---|
| Raw | -0.31 | 0.01 | -0.38 | -0.39 |
| Adjusted | -0.36 | 0.01 | -0.38 | -0.41 |
Negative correlations are due to lack of adjustment to defensive ratings for use with offensive efficiency (switching from lower = better to higher = better). However, from this, we can clearly see that defensive rebounding is just as important as any of the other defensive factors when it comes to offense. Michigan’s offense this season has shown this fanbase how defensive rebounding can trigger the break, but it is even more evident when you watch other leagues, where fewer teams put an emphasis on transition defense and sending players back on a change of possession and the game often breaks down into 2-on-2 or 3-on-2 runouts in each direction.
However, after all of this, I still believe that defensive rebounding is overrated as an individual metric. I'm not complaining about Jordan Morgan’s season, but he just isn’t a defensive game-changer in the way of Jeff Withey, Anthony Davis, Fab Melo, Nerlens Noel, or even A.J. Hammons. As has been stated, his high “stops” count is due to both Michigan’s excellent team Dreb% and Morgan's high individual number. His block and steal numbers are very low (his block% is 7th on the team, lower than all other starters, McGary and Horford). I might even argue that his presence has some effect on Michigan’s defensive philosophy and their inability to prevent three-pointers. With Morgan not a threat to alter shots inside, Michigan has to constantly switch on screens in order to prevent easy dribble penetration and 2-on-1 scenarios. They can’t fight over the top of screens to better challenge outside shots.
There was a great example of the effect that a shot-blocker has in the Iowa-Purdue game from Sunday, where Iowa’s players often had Purdue defenders trailing them after screens, but could not drive inside easily due to Hammon’s presence. Unfortunately, there weren't any Youtube highlights for that game, so I had to make due with the Michigan-Purdue game for an example.
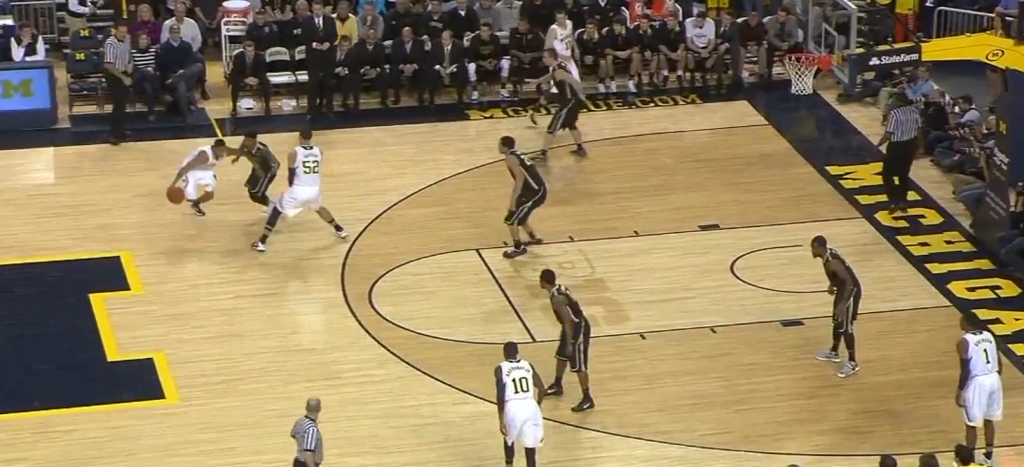
First, Morgan sets a good screen for Burke. Hammons did not follow Morgan out to the perimeter, and you can see Ronnie Johnson start to fight through the screen at the top.
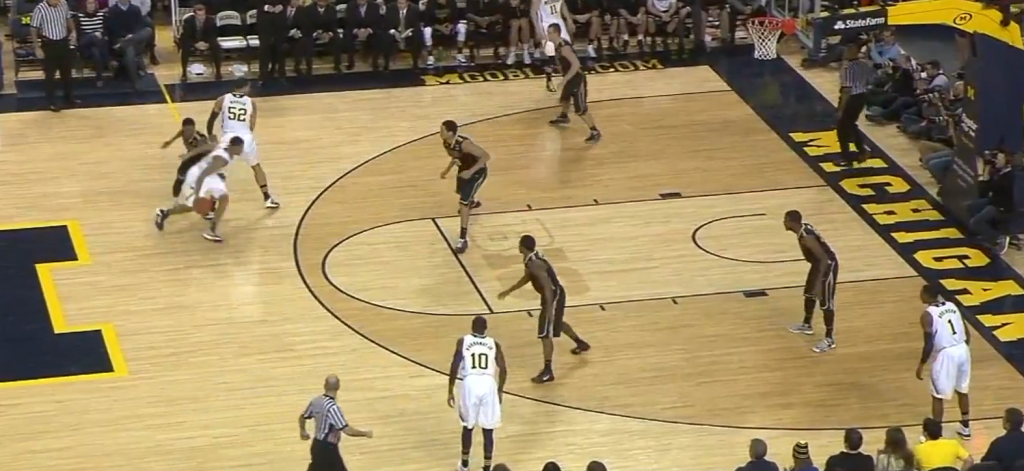
Burke is around the screen, but Johnson has followed him, preventing Burke from pulling up for an open three. Hammons is still in the paint, while Morgan is about to roll to the basket.
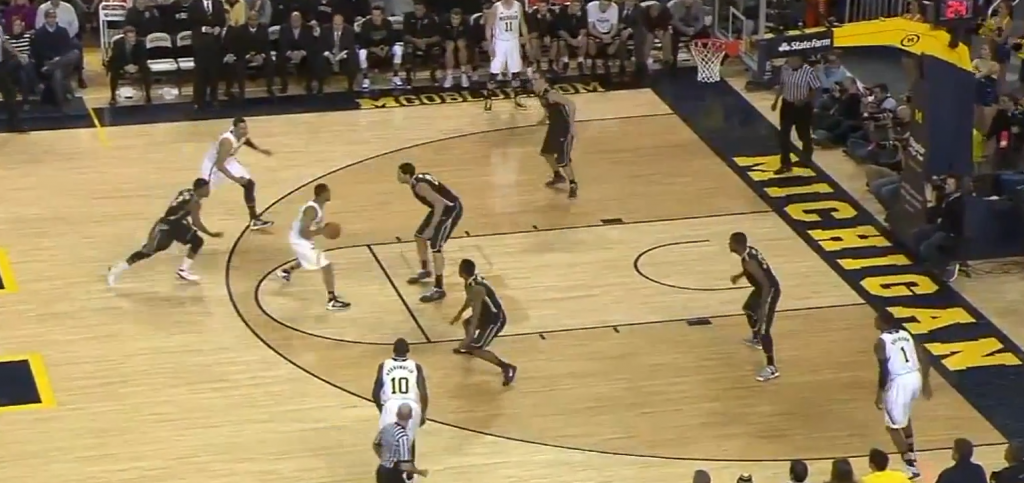
Finally, Burke has picked up the ball, unable to penetrate past Hammons or shoot over him. Purdue's defensive philosophy has helped remove the threat of a 3 from Michigan's balls-screen offense. Fortunately for Michigan, D.J. Byrd is still afraid of Burke and is about to jump in to help off Stauskas, leaving him open for a soon-to-be-bured 3. Not the best result for my example, but good for Michigan.
Further validating the importance of having a shot-altering presence: Correlation between block rate and defensive efficiency is very high (0.51), largely due to its influence on effective field goal % (correlation of 0.61).
This is all part of the bigger argument that the Big Ten Geeks make in their response to Brian's criticism-that post players/taller players should score higher on defensive metrics. Taller players can more easily influence defensive play away from their man, and playing on the interior puts you in better position for defensive statistics on every possession. Seeing as the objective of a perimeter defender is usually to prevent a single player from scoring/impacting the game, the best argument or evidence for an Oladipo or Craft would be to compare single game statistics vs season numbers for their primary defensive responsibility. They can’t impact the entire opposing offense and accumulate statistics in the same way as a Hammons or Berggren, but that’s a difference between the roles of perimeter defense and interior defense rather than a gap in defensive aptitude. You wouldn't want either of those guys I just mentioned chasing Trey Burke around the perimeter the way Christian Watford did, briefly, in last year's Indiana game. While Watford may have been successful initially, Burke got over the surprise and went on to score 18 points on 9 shots.
In my opinion, the best way to statistically evaluate individual defensive impact would be something similar to what Ace posted on Tuesday, evaluating lineups and considering an individual player’s ability to improve team defensive statistics while they are in the game. Now, this isn’t as fair to players like Caris LeVert and Spike Albrecht, who are rarely on the court with four other starters (theoretically the better defenders), but we could make an initial assumption that the other rotation players are all roughly equivalent when analyzing an individual player. It’s also unfair to players like Trey Burke, who might play 90% of the team’s minutes any given night and have a limited sample of largely garbage time minutes against which to compare the impact of their absence. That said, it would provide a better picture of a player’s ability to influence the opponent’s offensive strategy and results.
I am very curious to see the 3PA/FGA ratios and 3P% isolated for Michigan's three centers. Even though the team defensive philosophy remains the same for all three,it would be enlightening if opponents were taking more threes (or lower quality threes) depending on which player was protecting the paint. Ken Pomeroy wrote a blog post this week discussing the Syracuse zone and its (limited) ability to force lower quality three point attempts. Any effect at Michigan would likely be much smaller than that seen at the schools discussed in his post, but would still be worth examining.
12