2013 Turnover Analysis–Updated Thru NW
No Turnovers?: It is extremely rare in football when neither team has a turnover. The last time this happened to Michigan was three years ago in the Penn State game in 2010. The official stats for the game will document there was a turnover and will be misleading. It was fourth and 23 in OT and the game would have ended on that play with merely an incomplete pass rather than the interception in the end zone. But, Thomas Gordon will be happy and it does help Michigan's turnover stats.
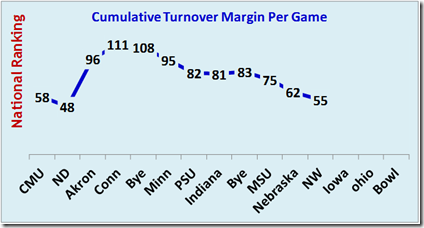
Synopsis: Michigan's TOM for the game was +1.0 and for the year is now +1.0 (+ 0.10 per game) which improved slightly to #55. Turnovers were not a primary factor in determining which team won the game. In fact, turnovers have not been a factor in determining which team has won the game in any of Michigan's games this year.
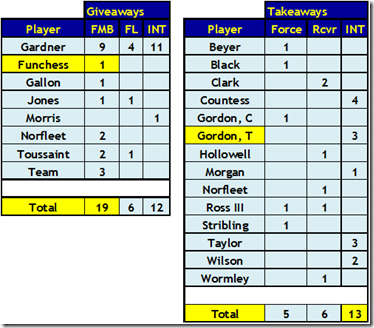
Funchess had the one fumble in OT but recovered it himself. Thomas Gordon ended the game with his interception (his third of the season).
Michigan is +6.0 in TOM for B1G conference games which is second only to MSU at +8.0. And yet, M is a mediocre 3-3 in conference play. Perhaps the 2.3 YPA for rushing in B1G conference games has something to do with that (ranked #11 in B1G and 34% less than the next worse – Illinois at 3.5 YPA).
Versus Iowa: For the year, Michigan and Iowa are virtually identical for turnovers. Iowa has 1.6 giveaways per game ranked #57 and 1.60 takeaways per game ranked #75 with a 0.00 TOM per game ranked #61. But, Iowa is –0.20 TOM for home games. Michigan has a +0.3 TOM for home games and has a -0.2 TOM for away 3 games. For B1G conference games, Iowa's TOM is –1.0 and is ranked #7.
 Player Details: Here is the overall summary for all games by player (data in yellow was affected by this week's game).
 National Rankings: All rankings include games between two FBS teams ONLY and are from TeamRankings except for forced fumbles which is from CFBStats.
  The four columns with *** show the best correlation to offense and defense (per Advanced NFL stats).
 Turnovers And Winning: This chart shows turnover margin (TOM) at the end of the season versus the percentage of teams with a +4 WLM (8-4 record) or better. [WLM = Win/Loss Margin = Wins – Losses]
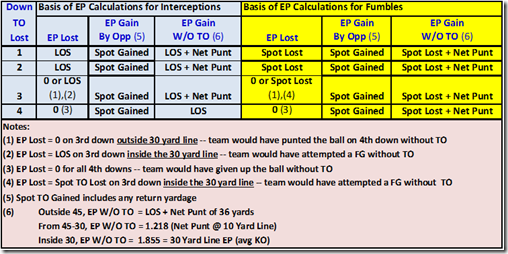
Expected Points: The impact of each turnover depends upon the down, the spot the turnover is lost, and the spot the turnover is gained. 
This chart shows Expected Points for various yard lines.
This chart shows the basis of EP calculations for each turnover.
November 20th, 2013 at 12:10 PM ^
Fewer turnovers, but our offense is sputtering compared to the beginning of the year.
I wonder how much of it is a product of Borges telling Gardner no turnovers (therefore he holds on to the ball longer, takes more sacks, etc.), playcalling, strength of opponents, etc.
November 20th, 2013 at 4:22 PM ^
Gardner played the last four games last year and had just 1 int per game. M scored 35, 38, 42, and 21 points against Minn, NW, Iowa, ohio.
This year, it was 9 ints in the first 4 games. Since then just 3 in 6 games. The first 3 of those games the offense was still humming with 42, 40, and 63 points.
The last three games the offense has cratered. I don't think the talent level has changed or the level of competition.
It just appears we are being outcoached.
![image_thumb8_thumb_thumb_thumb_thumb[2] image_thumb8_thumb_thumb_thumb_thumb[2]](https://mgoblog.com/sites/mgoblog.com/files/image_thumb8_thumb_thumb_thumb_thumb%5B2%5D_thumb.png)

Comments