2012 Turnover Analysis – Updated Thru ND
Preseason Prediction (Which Is Looking Pretty Silly Right Now): Michigan will end the year with a +8 Turnover Margin (TOM) or better (2011 was +7). The prediction for TOM for M for this year is based on the prediction that M will be a very good team again this year and is not based on the actual TOM of last year. (Very good teams will have a TOM of +5 or better.)
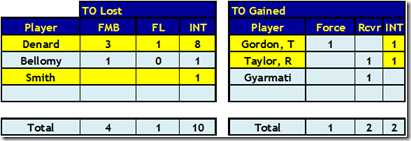
C'Mon Man!: As I watched MSU struggle in their game against EMU, I thought, "we can beat ND!" And we should have (yeah, I know – coulda, shoulda, woulda). Denard has thrown a lot of interceptions in his career (4 in 2009, 10 in 2010, 14 in 2011) but has only thrown 3 picks 3 times (MSU in 2010, ND & NW in 2011). Since Denard's interception at the end of the first half was completely meaningless, this was really his 4th game with 3 interceptions (although the official stats will record it as 4 interceptions). For the year, that is 8 interceptions for DRob and a 8% interception ratio (ranked #123). Last year, Robinson finished the year with a 5.6% interception ratio (ranked #104). DRob did show marked improvement last year in his interception % over the final 9 games going from 8.3% in the first 4 games to 4.7% in the final 9 games. (BTW, 4.7% is still horrible.) Unless the interceptions stop, M is basically starting every game with a TOM of –2 .
Despite what you may have been led to believe, Denard has better statistics this year than last year! Obviously, the only meaningful comparison is between the first 4 games played this year versus the first 4 games last year. After the first 4 games, DRob's interception% is 8.0% this year vs. 8.33% last year. He also has just 1 lost fumble versus 2 lost fumbles in 2011. And, he has completed 53% of his passes vs. 49% last year. Unfortunately, Denard has attempted 100 passes this year versus just 72 last year – that is an increase of 39%!! You may have also forgotten that DRob threw those 3 interceptions last year in the ND game but the 4 TOs by ND (not including the meaningless ND TO at the end of the game) more than negated the interceptions thrown.
M is now –7 in TOM and only a dramatic turnaround (of epic proportions) will avoid a negative TOM for the year. Over the past decade, only 28% of teams with a TOM of –4 or worse have had winning records.
After 4 games last year, M had 6 interceptions and 2 fumbles for a total of 8 giveaways. We had intercepted the opponent 4 times and recovered 9 fumbles for a total of 13 takeaways and a TOM of +5 (ranked #12).
Synopsis for Turnovers: M picked up their first 2 interceptions gained (Gordon & Taylor) and is ranked #67. ND did not fumble and M ended the game with a total of 4 Takeaways for the year (ranked #87). The total of 10 interceptions lost is ranked dead last at #124. The only good news is that M has lost only 1 fumble (ranked #11). Overall the total is 11 giveaways (ranked #109) and a TOM of –7 (ranked #113).
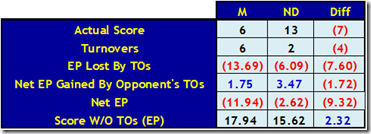 Synopsis for Expected Point (EP) Analysis: Unfortunately, we got our first game where TOs were significant. I am sure no one is surprised that a TOM of –3 (adjusted for the meaningless interception at the end of the half) was the primary reason M lost this game.
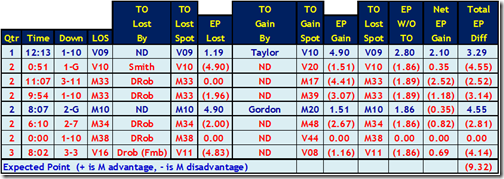
 The analysis indicates a net loss of 9.32 EP for Michigan. M lost nearly 14 points because of their TOs and gained less than 2 points from the ND turnovers for a net loss of 12 points for M. ND lost 6 points because of their TOs and gained nearly 3.5 points from the M TOs for a net loss of less than 3 points for ND.
The folks at Football Outsiders – FEI are also doing weekly "Revisionist Box Scores" that strips out TOs, Special Teams, and Field Position. They show all games where the impact of these items would have impacted which team won the game. In their analysis, Total Turnover Value (TTV) for Michigan in the ND game was: TTV+ = 21.7, TTV- = 9 for a TTV Net = 12.7 and an adjusted score showing a M win by 5.7 points. Thru Week #4, here is their summary: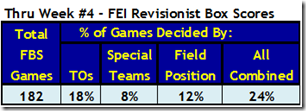
(See the Section on Gory Details below for how the adjustment for Expected Points (EP) is calculated.)
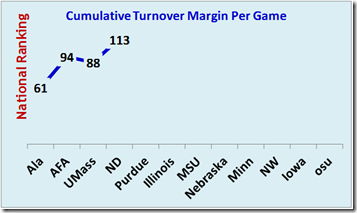 National Rankings: Ugly, ugly, ugly. All rankings include games between two FBS teams ONLY and are from TeamRankings except for forced fumbles which is from CFBStats.
  The four columns with *** show the best correlation to offense and defense (per Advanced NFL stats).
The Gory Details
Details for Turnovers: Here is overall summary for all games by player (data in yellow was affected by this week's game).
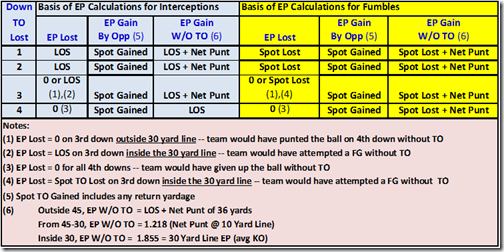
Expected Point (EP) Analysis: Basically, the probability of scoring depends on the line of scrimmage for the offense. Therefore, the impact of a TO also depends on the yard line where the TO is lost and the yard line where the TO is gained. Each turnover may result in an immediate lost opportunity for the team committing the TO and a potential gain in field position by the opponent. Both of these components can vary dramatically based upon the down when the TO occurred, the yards the TO is returned, and whether the TO was a fumble or an interception.
Here are the details for the game.
The analysis is a bit tricky because: (A) the TO may directly result in lost EP for the offense but (B) only modifies the EP for the team gaining the TO because the team gaining the TO would have gotten another possession even without the TO (due to a punt, KO after a TD, KO after a field goal, etc.). The Net EP Gain must take into account the potential EP gain without the TO. The EP gain without the turnover is based on where the field position would have been for the next possession if the TO had not occurred.
![image_thumb17_thumb_thumb_thumb_thum[1] image_thumb17_thumb_thumb_thumb_thum[1]](https://mgoblog.com/sites/mgoblog.com/files/image_thumb17_thumb_thumb_thumb_thum%5B1%5D_thumb_0.png) The expected point calculations are based on data from Brian Fremeau at BCFToys (he also posts at Football Outsiders). Fremeau's data reflects all offensive possessions played in 2007-2010 FBS vs. FBS games. I "smoothed" the actual data.
The expected point calculations are based on data from Brian Fremeau at BCFToys (he also posts at Football Outsiders). Fremeau's data reflects all offensive possessions played in 2007-2010 FBS vs. FBS games. I "smoothed" the actual data.
Here is a summary of the smoothed expected points.
September 26th, 2012 at 11:21 AM ^
It can only get better, right? RIGHT?!?
September 26th, 2012 at 11:32 AM ^
Yes, of course. But I don't have any explanation of why Denard's interception % would improve so dramatically during the last 9 games of last year. Just hope it repeats again this year.
September 26th, 2012 at 11:30 AM ^
Brian cackles in sorrowful glee - "this is the return to the mean I was talking about, BAHHAHAHAHA"
September 26th, 2012 at 11:46 AM ^
Most TOM conversations have an underlying asupmtion that the turnovers will come evenly distributed. That is, that a team that ends up at +24 accumulates them at a rate of 2 per game. We know this isn't the case. So, a team can have a bad turnover ratio and a good record if they're neutral in their wins and heavily negative in their losses. This describes Michigan to a T so far this year.
Denards issues feel correctable to me so I'm optimistic there. All's we gotta do is keep pressure off of him and brainwash him into tucking and running. Totally doable. The bigger frustration to me is the lack of turnover production from the defense. But, again, it seems like they're getting their legs and I'm optimistic that they'll start trending back toward average.
Also, random. (I just can't help myself...)
September 26th, 2012 at 1:37 PM ^
You are absolutely correct. TOs are not (and never have been) evenly distributed.
Last year, M had 2 games with zero TOs, 5 games with 1 TO, 2 games with 2 TOs, 3 games with 3 TOs, and 1 game with 4 TOs.
In order by game: 0 3 1 4 0 3 1 2 2 3 1 1 1
Also, NOT random (I too just can't help myself.....)
![image_thumb31_thumb_thumb_thumb_thum[1] image_thumb31_thumb_thumb_thumb_thum[1]](https://mgoblog.com/sites/mgoblog.com/files/image_thumb31_thumb_thumb_thumb_thum%5B1%5D_thumb_0.png)
Comments