Visualizing The Hennechart

Editors note: bumped from the diaries for research, interesting-ness, and cool graphs. Republished to get the images the right size. Original here for those who'd like to see the comments on it.
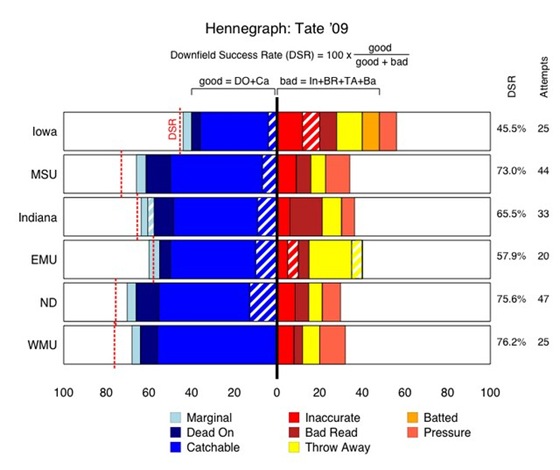
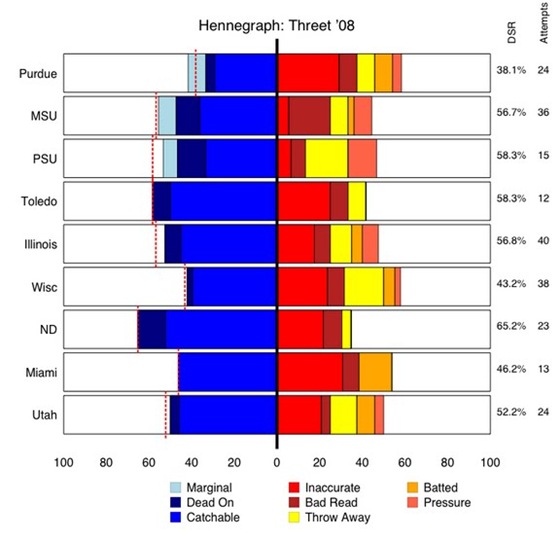
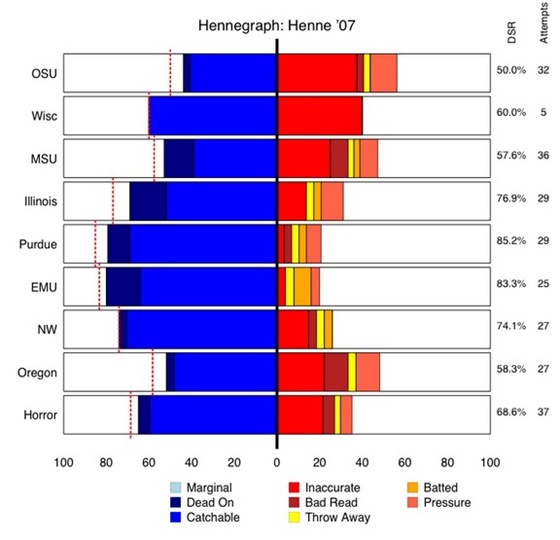
Some days ago, I made a first attempt at visualizing some of Brian's famous Hennecharts. After some feedback (thanks all) and some links to old data (thanks Misopogon), I now try again. Here are "Hennegraphs" for Tate so far this year, Threet from '08, and Henne from '07.
Tate so far this year: 
[Note: the hashed areas are passes I separated out as screens, which is new this year.]
Threet '08: 
and Henne '07:

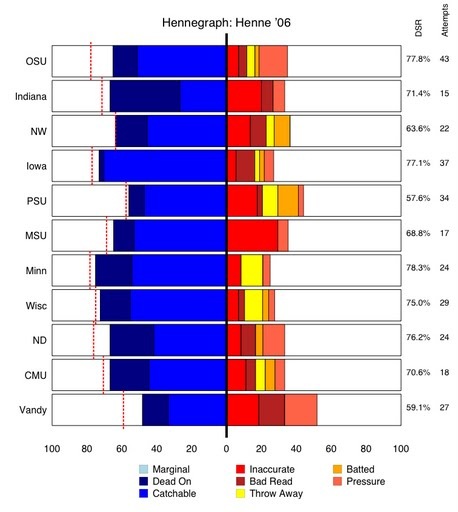
And finally, Henne in the near-championship year '06:

Some explanations: I took Brian's suggestion to center at 0, pushing "good" events to the left, and "bad" events to the right. Slight adjustment: I moved "Marginal" all the way to the left (it is neither good or bad, but made slightly more sense on the left instead of centered in the middle, as we will see in below).
Recall also that bars that are not fully colored in represent screen passes (which Brian has started accounting for lately).
Also on the Hennegraph: Brian's metric of effectiveness, the Downfield Success Rating (DSR). The Tate '09 graph shows how this is calculated: DSR is the number of (Dead On + Catchable) throws divided by everything else except for Marginal and Pressure. Thus, it is the left blue part (ignoring marginal all the way on the left) divided by the blue part + right red/orange/yellow (ignoring pressure all the way on the right).
I also present the DSR percentage on the right of each bar, as well as the total number of attempts, and graphically depict the DSR number on the left in a dotted red line.
Putting all of this together made me realize the simple genius of what Brian is doing here. Instead of judging a QB by a simple number such as "percentage of passes completed" or some odd QB rating, he is simply analyzing each throw and qualitatively judging them in isolation of whether they were caught or not. Thus, DSR is an excellent replacement for "Completion Percentage" if you are just interested in measuring how well a QB is throwing the ball.
Hope you enjoy. As always, comments are welcome, and thanks to Brian (and Misopogon!) for the grading and the data; any errors, of course, in the Hennegraphs above are mine.
[Notes from me: You can see just on the charts how far the passing game has come from the "good" half of last year, and how far from a healthy Chad Henne—ie, 2006—it still is. And how awful it was for Michigan to suffer Henne's loss in '07.]
Comments