Splitting a White Rainbow
In a previous diary I used passer rating as a well known and objective grade for the relative value of a quarterback’s stat line in order to determine if there were any trends in player development, and if so, how strong those trends were. However, in the diary I noted that passer rating is not without its issues and pointed those interested in finding out toward other people’s work and went on with it.
Most Declarations of Grievance attack the adequacy of the the formula used saying that the scale is unintuitive, some of the components are not orthogonal (total yards, completion %), some components are irrelevant (touchdowns), and other components are omitted (rushing stats, and sacks). These are valid arguments but the alternatives presented are unfamiliar, come with their own set of complexities, and are often difficult for fans to calculate on their own.
In this diary I don’t want to generate a new formula, that has been done. Rather, I want to accept the current formula for what it is and develop new benchmarks for what it shows us in modern context. The two problems I have with it are that it’s clearly outdated and that it obliterates information.
Problem 1: It’s Old and Busted
The current NCAA passing efficiency formula (shown below) was developed in 1979 and was generated using passing data since the beginning of the modern two platoon era which began in 1965. At the time, the rating was calibrated to yield a rating of 100 for the average passer. If a QB had average values for all 5 components (attempts, completions, total yards, touchdowns, interceptions) his passer rating would have been 100.
Here’s the rub, major rule changes have been implemented in favor of the passing game since two-platoon football started, and so the majority of the data set used to calibrate the formula was skewed toward weak passing numbers by today’s standards. The major rules changes are:
- 1976: Offensive blocking changed to permit half extension of arms to assist pass blocking.
- 1980: Retreat blocking added with full arm extension to assist pass blocking, and illegal use of hands reduced to 5 yd. penalty.
- 1985: Retreat block deleted and open hands and extended arms permitted anywhere on field.
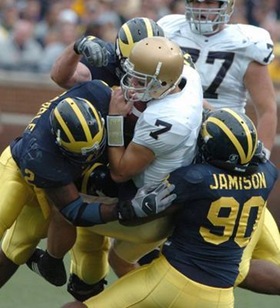 And these aren’t even all of them. Behold, further evidence of Anthony Carter’s ridiculousness: he thrived in an era where the rules were stacked against the pass. Before these rules were implemented, offensive linemen could not really be aggressive in pass blocking. They were forced to be either turnstiles (before 1976) or turnstiles with their elbows sticking out. Before ‘85, linemen could not have their palms facing the opponent. Back in the day illegal use of hands and holding penalties were 15 yards assessed from the spot of the foul. Cloud of dust football so popular back then for a reason. For a modern taste of what this might have looked like check out Michigan v. Notre Dame 2007. The mismatch between Michigan’s D-Line and Notre Dame’s O-Line in that game was obscene. Despite that Jimmy Clausen’s freshmen year performance at Notre Dame, on that terrible offense, was slightly above average by 1979 standards.
Due to the rules changes, passing stats have inflated but the formula has not adapted along with them. That is not to say that it has no value, just that our understanding of that value is outdated.
Problem 2: It’s A White Rainbow
Imagine if a rainbow were a brilliant white arc in the sky; still interesting, but less so than what we usually see. If the water droplets in the air can not produce a prismatic effect, they just diffract the light and we can’t see the individual colors. BTW, white rainbows are real.
Getting back to football, the passer rating formula looks at, yards per attempt, completion %, touchdown rate, and interception rate, then assigns weights to those values and blends them together to provide football fans a single number to use to compare QBs against themselves and each other. All in all that is a useful tool, but the blending process obliterates some very interesting information. Passer rating is a great coarse filter but it’s inadequate for picking up subtle differences. Not all 130’s are created equal.
Re-Calibration
In order to address the first problem, it is necessary to decompose the formula into it’s base components to see what the new definition of average is for each category. For college players, I think it is also useful to split the data by recruiting ranking (Rivals.com Star Rating) and Experience (Years as Starter) to really understand how well a kid is performing relative to history.
For this project I’ve taken only players who played on teams in BCS conferences and who were rated as a Rivals.com 3-star recruits or higher. The data plotted is the average for all players within a given category (ex: all 3 start players in their 1st year as Starter is a group, and so on).
One thing I should note up front is that there are fewer and fewer players in each category as the number of years as starter increases; only about 10% of QB recruits in each group start for four years. For the 3-star and 4-star groups this isn’t a huge problem because they survive the attrition fairly well and still have 7 or 8 players to use for averaging purposes; not great by any means but workable. The 5 star group ends up with 2 players in my data set that have started 4 years (Chad Henne and Trent Edwards). A sample size of 2 is not workable and has therefore been omitted.
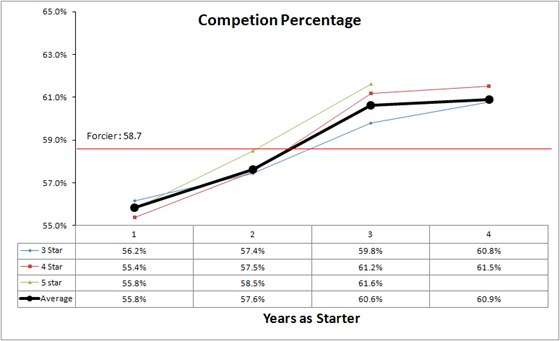
For completion percentage we see that the average QBs gradually improves his accuracy and approaches 61% in the long term. The higher a player is rated coming out of high school, the sooner he is likely achieve steady state.
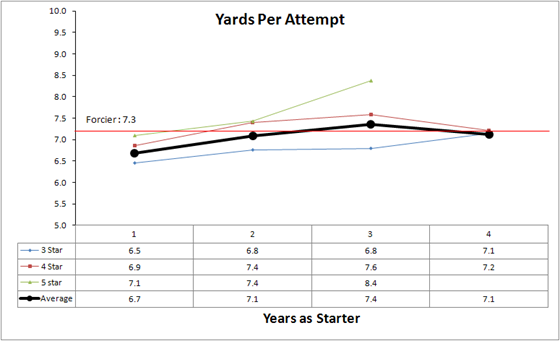
With Yards per attempt we see a more subtle upward trend and also more separation between rating groups. I think this separation makes some sense. For one, Rivals explicitly accounts for the players physical assets; it stands to reason that 5-star players are more likely to develop NFL-level arm strength and will therefore be able to push the ball up field without sacrificing accuracy significantly. Another potential factor is that a high level QB recruit is likely to attract high level WR recruits that help improve YPA significantly. I think the long term standard that should be applied for this category is 7.6 yards per attempt.
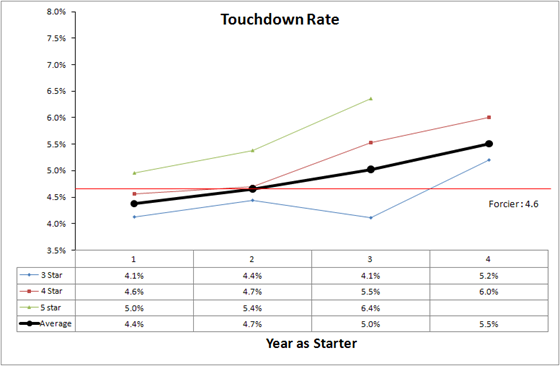
Touchdown rate is a factor that many people argue against including in the passer rating formula. The argument goes that a TD is as much a result of the WR’s ability as it is the QB’s. The Roundtree hawk down at Illinois is an example: Edwards, Manningham, Breaston, Odoms, and a bunch of other guys would have taken that ball to the house. I think this chart shows this effect pretty dramatically. The 5-star recruits tend to go to high level programs and are surrounded by high level offensive lines, running games, and receiving corps, thus making it easier for them to throw touchdowns. Oh yeah, and they’re more likely to have the skill to exploit their advantages. Long term target: 6.0%.
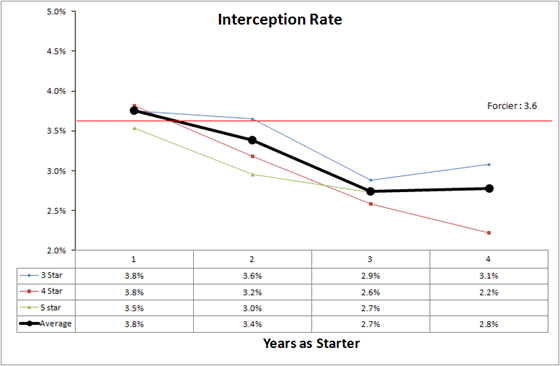
Interception rate is the only negative factor in the formula, so a lower number is better (duh). Again we see 3-star recruits significantly lagging the other two groups. I suspect that not only is there the experience issue, but 3-star recruits are likely to need more time to develop proper mechanics. By year 3, all groups are about as good as they’re going to get. Long term target: 2.7%.
The New Hotness
Cherry picking the long term values for these parameters allows us to assemble a passer rating that is a true indication of good passing efficiency in college, not just objectively point but also subjectively; that value is 139.2. This is a stout target to hit and the player needs help from his team mates to get there, but it is achievable for all BCS level recruits by their 3rd year as starter. In 2009, 33 QBs put up this level of performance or better with another 10 or so within reasonable striking distance.
...interesting to investigate the correlation between passer rating and team success.
A couple of observations:
- The number one and number three passers were Tebow and Clausen on teams with substantially different success.
- There were 13 top 25 teams with QBs >/= 139.2 were: Alabama, Florida, Texas, TCU, Boise State, VT, Cinci, PSU, BYU, Pitt, Arkansas, Miami (YTM), Utah
- There were 12 top 25 teams wth QBs < 139.2 were: Ohio State, Iowa, Oregon, Georgia Tech, LSU, Nebraska, Oklahoma, Ole Miss, USC, Clemson, Wisconsin, Texas Tech
- The average Sagarin team ratings for teams with a QB that met the 139.2 metric was 40:
| Name | Team | QB Rating | Team Rating |
| Tebow | Florida | 164.2 | 2 |
| Moore | BSU | 161.7 | 5 |
| Clausen | ND | 161.4 | 48 |
| Hall | BYU | 160.1 | 15 |
| Padron | SMU | 159.9 | 65 |
| Enderle | Idaho | 157.3 | 85 |
| Keenum | Houston | 154.8 | 53 |
| Mallett | Arkansas | 152.5 | 18 |
| Dalton | TCU | 151.8 | 4 |
| Webb | UAB | 150.7 | 99 |
| Stull | Pitt | 150.6 | 16 |
| LeFevour | CMU | 150.3 | 42 |
| Pike | Cinci | 149.8 | 8 |
| Taylor | VT | 149.4 | 7 |
| Wilson | NC State | 147.8 | 74 |
| Ponder | FSU | 147.7 | 31 |
| McCoy | Texas | 147.4 | 3 |
| Skinner | Wake Forest | 147 | 56 |
| Brown | Troy | 146.1 | 69 |
| Todd | Auburn | 145.7 | 27 |
| Young | Southern Miss | 145.7 | 77 |
| Colburn | Fresno State | 143.7 | 59 |
| Luck | Stanford | 143.5 | 29 |
| Tolzien | Wisconsin | 143 | 23 |
| Clark | PSU | 142.6 | 10 |
| Kinne | Tulsa | 142.6 | 96 |
| Cousins | MSU | 142.6 | 55 |
| Canfield | Oregon State | 141.9 | 34 |
| Vancamp | Florida Atlantic | 141.2 | 114 |
| McElroy | Alabama | 140.5 | 1 |
| Gabbert | Missouri | 140.5 | 54 |
| Harris | Miami | 140.1 | 21 |
| Daniels | USF | 139.5 | 39 |
| Cain | Utah | 139.4 | 24 |
| Average Team Rating | 40 | ||
- The average passing rating for the top 25 teams (minus Georgia Tech, whose QB was not ranked in the top 115 in passing efficiency) is 141.5.
| Team Rating | Team | QB Rating |
| 1 | Alabama | 140.5 |
| 2 | Florida | 164.2 |
| 3 | Texas | 147.4 |
| 4 | TCU | 151.8 |
| 5 | Boise State | 161.7 |
| 6 | OSU | 128.9 |
| 7 | VT | 149.4 |
| 8 | Cinci | 149.8 |
| 9 | Iowa | 131.6 |
| 10 | PSU | 142.6 |
| 11 | Oregon | 129.5 |
| 13 | LSU | 137.2 |
| 14 | Nebraska | 126.9 |
| 15 | BYU | 160.1 |
| 16 | Pitt | 150.6 |
| 17 | Oklahoma | 130.8 |
| 18 | Arkansas | 152.5 |
| 19 | Ole Miss | 124.8 |
| 20 | USC | 131.3 |
| 21 | Miami | 140.1 |
| 22 | Clemson | 124.4 |
| 23 | Wisconsin | 143 |
| 24 | Utah | 139.4 |
| 25 | Texas Tech | 137.1 |
| Avg Passing Rating | 141.5 | |
So by my feeble analysis:
- Teams with QBs that meet or exceed MCalibur's QB rating have an average team rating of 40
- It's just as likely to be a top 25 team with a QB that meets MCalibur's QB rating metric as it is to be one with a QB that doesn't
- On average, top 25 teams have QBs that exceed the QB rating metric established by MCalibur
That correlation is tricky because winning has a lot to do with your defense and turnover margin. Of course the QB has a lot to say about turnovers by limiting INTs but good QB play alone isn't enough to win games.
That said, Brian Burke (Advanced NFL Stats) has a lot of work with win correlations. He has a four part series (here, here, here, and here) and found that the single most important factor in winning games is passing YPA followed by defensive passing YPA. Pretting interesting stuff. For what it's worth, "stopping the run" come in last in the study.
However, when you add up the offensive categories and the defensive categories, you end up with a good balance with a slight edge toward offense.
Comparing the sum of all offensive weights with the sum of all defensive weights yields a very balanced result. Offensive variables add up to a total weight of 2.38 vs. a total weight of defensive variables of 2.34. Although the defensive variables appear slightly stronger, the relative sums of the weights are within 1.7%--remarkably balanced.
Passing is indeed far more important than running, and although offense appears more important than defense, they're equally important.
But it seems like everything statistically measured about a QB also relies on the quality of the team around him, AND the opportunities the defense provides him per game. Some factors rely more, and some less on the team around the QB, but even total attempts seem like it's not without dependence. For example, a poor offensive line results in more sack/hurries/batted balls, and are those ranked as incompletions or just nullified as an opportunity?
The fact that just as many above average QB's appear on above and below average teams seems to say to me that the QB rating as it stands is sufficiently independent. The added conclusion that Offense and Defense is nearly equal (but if anything a slight edge to offense) seems to fit the intuitive obviousness that you can't win if you don't score, and every play starts with the QB, therefore his play is always a high factor in a plays success.
I'll repeat that I'm not experienced in the wealth of existing analysis, nor deep in how to use statistical methods, but if I rely on both of you for that expertise, I conclude that the existing formula is sufficient for comparing QB's across teams, and across their experience progression.
And overall I love reading this stuff. I'm not as much a fan of the individual recruiting progress, but I love the analysis of the game, tactics and strategy.
please keep it up.
Wow. You need to send this into the NCAA. Just the history of how we got to the current forumula is fascinating. The blocking rule changes are as well. (We used to play with balled fists against our chests - elbows out.)
At 128.15, I guess Tate has some improving to do. Coner had a 150 rating though! (On a sample of 5 attempts, I'm not stupid ...)
Awesome analysis!
Thanks for this...it would be interesting to build on this by looking at the defenses that the various qbs faced...being a math moron, I have no idea how to do that, or even how valid it might be, but I can't help but think that facing a bunch of good defenses week after week will dramatically affect a qb's performance rating...
You mentioned that there are other factors involved in what makes a good QB that aren't looked at within passer rating. Mainly rushing yards, rush yds per attempt, and rushing TDs. I think it would be super cool to add these and then recreate those graphs.
But I think that type of rating would over-inflate the performance of mobile QBs. Guys like Pat White and Tim Tebow were great passers in their own right; the fact that they were great runners too made them lethal. Passer rating is strictly meant to evaluate a players ability to pass the ball, not his ability to play QB. There's a significant difference.
Also, offensive scheme plays a large roll in pass efficiency. Josh Nesbitt has a surprisingly high passer rating (148.7). His completion percentage (45.6) is atrocious, but his YPA (10.5) and TD rate (6.1%) are equally obnoxious in the other direction. The triple option makes defenses sell out to stop the run, leaving big passing plays available. WIthout splitting the rainbow, you might conclude that Nesbitt is under utilized as a passer. I think White and Tebow, though legitimately good passers in college, also benefitted from a system that allowed players to make big plays.
Probably the best answer to the question is defense adjusted value over average from the QB position--what Football Outsiders and The Mathlete do.
Great diary, thank you. However, my research shows that 1945 was when the two platoon system first debuted (debuting in the Army-Michigan game). In 1952, they went back to one platoon. The year 1965 was when they implemented unlimited subs, which was in effect a return to "two platoon," except the original debut of two platoons didn't allow unlimited subs.
I didn't want to get into all that. I was just trying to convey that 1965 is really the start as football as we know it except for the evolution of the passing game from the late 70's to the mid 80's. Maybe that idea is better conveyed with the term modern two-platoon system.
....Michigan Today article on Fritz Crisler gives the entire history of the evolution of the WWII and the modern platoon systems.

Comments