Baseball Stat Watch: Conference Midpoint
Now that we've reached the conference midpoint and looked at the conference outlook, it's time to take a look at the team stats. Unlike in previous editions, the graphics will include some pitching related stats despite too small of a sample size to be that meaningful. The pitching stats are starting to show some trends, though.
As another reminder, these stats aren't official, but they should be pretty close. I have to compile these by going through every box score and input them into Excel tables. Many times, box scores contain errors that are corrected in the official statistics, but they may not be adjusted in the online box score.
So, as I start each of these posts, we'll look at the three major derived stats that are readily available in the college game (batting average, on base percentage, and slugging percentage):
In that AWESOME EXCEL GRAPH, you can see each of the percentages as they accumulate over the season. It should be pretty obvious that as the season goes along, the lines should normalize to the average as more data comes in. What may be a bit more difficult to see is that Michigan's offense peaked in the Central Michigan game. At that time Michigan was hitting .328 (BA) and .411(OBP). The slugging picked up a bit since then, peaking in the offensive explosion in Illinois game one, with a .477 slugging percentage.
Michigan currently sits at .321 (BA), .404 (OBP), and .470 (SLG). That ranks 3rd, 3rd, and 4th in the Big Ten respectively (more on this below). In terms of conference only stats, Michigan is at .322 (BA), .411 (OBP), and .469 (SLG), which means we've done a little bit better in conference in terms of getting on base, but everything else has been pretty similar to the non-conference season. That's pretty surprising given the difference in talent we've faced, but at the same time, Michigan has had a couple of anemic offensive games against some of the Big Ten's best pitchers (Hippen, Bischoff, Leininger), and they've had some explosive games against some of the not so good (Illinois win).
Speaking of talent difference between conference and nonconference, the purple line in the above graph, for those who didn't pay attention last time, represents the RPI of our opponents. The number one team in Boyd Nation's pseudo-RPI would be a 1.000, and a team holding the #302 RPI (or any non-D1 opponents if you're a Buckeye who plays AND LOSES to D2 and NAIA teams) would register as a 0.000 score. From that, you can see that our non-conference schedule was pretty difficult with two games against #1 Coastal Carolina, but our last few games, as well as the Big Ten regular season are quite a drop in competition.
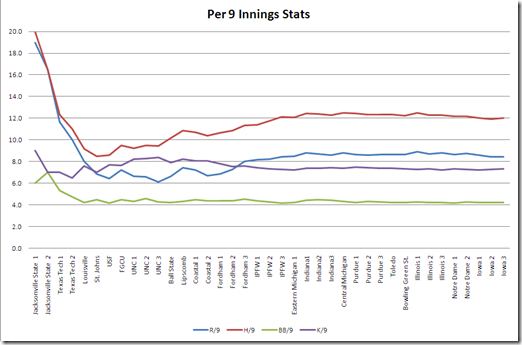
The second graph I tend to post up is per nine innings stats, particularly runs, hits, strikeouts, and walks. These are just the sum of our total stats accumulated over the number of innings Michigan has batted (a home win normally only has 8 innings, as compared to any road game having 9 innings). Taking a peak:
Looking at the above, we can clearly see the differences between "OMG WE LOST LAMARRE" and the the team becoming stable. LaMarre came back against Central Michigan, where we can see a small jump in hits and runs, but not much in terms of long term changes. The only long term pattern that comes from the post-LaMarre return is a slight drop in strikeouts, a product of Krantz and Stephens getting less at bats.
At the time of LaMarre's return, I probably would have predicted an increase in hits and runs per game, but as we'll see in a bit, a couple of players have really cooled down over the last few weeks, most notably Coley Crank.
For individuals and a brief look at pitching, follow the jump. Warning, it gets long. Probably unnecessarily long. But it is what it is.
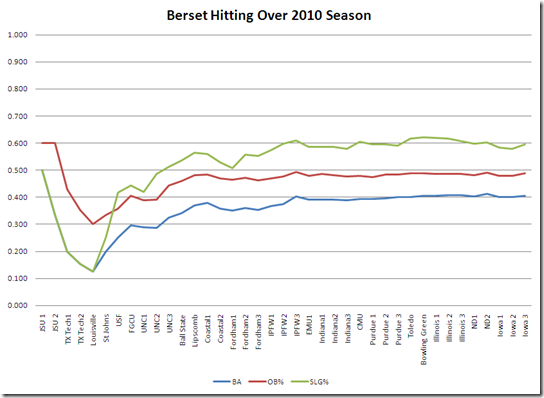
We'll start with the positives first. There's only one player who has continued to increase their stats as the season has gone along (outside of LaMarre), and that's senior captain Chris Berset:
Berset has seen his average steadily increase, now sitting at .405. This increase in batting average has also helped off set his decline in extra base hits as well. Over the last 14 games (since LaMarre's return), Berset has only 6 extra base hits (5 doubles and a homer). As a comparison, he had 8 extra base hits in the 9 games previous. On the season, he's slugging .595, but he's done well getting the timely hit. He's registered 16 RBIs since LaMarre's return, including 12 in Big Ten play.
On the opposite end is Coley Crank. Crank, despite being one of the only players to have a decent weekend against Iowa, has really struggled in Big Ten play.
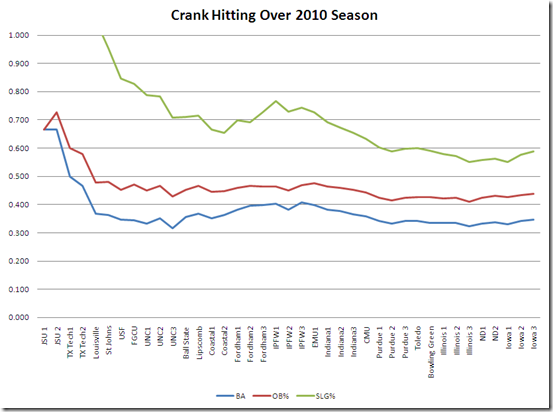 The first two weeks were off the charts.
Here's hoping that the double at Notre Dame and the drop behind Dufek wakes his bat up a little bit. He did manage to close out the Hawkeye series with a pair of multi-hit games, including a homer and a triple.
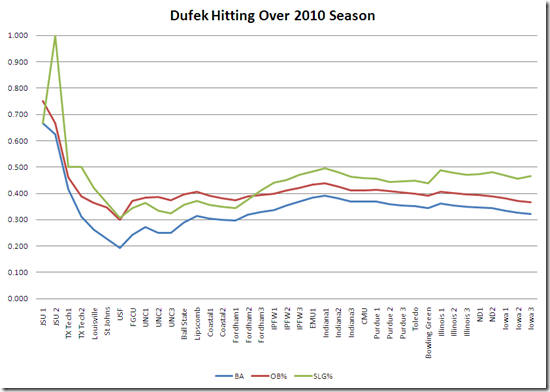
As for Dufek moving up in the lineup, I'm not sure that's worked out quite so well for Mike.
Dufek has seen a solid increase in slugging in comparison to his batting an on-base numbers, but it's made him a bit streakier. His strikeout numbers have also jumped considerably since the start to Big Ten play. Coming into the Indiana series, Dufek was striking out 1 in every 7.58 at bats. His current season ratio is nearly twice as often, with one K in ever 4.35 at bats, thanks to a 7 K weekend against Iowa (oddly, only one came in the Hippen start). I'm alright with this for now, but as I've lamented before, I prefer on-base percentage with gap power of strikeouts and homers. Just a personal preference.
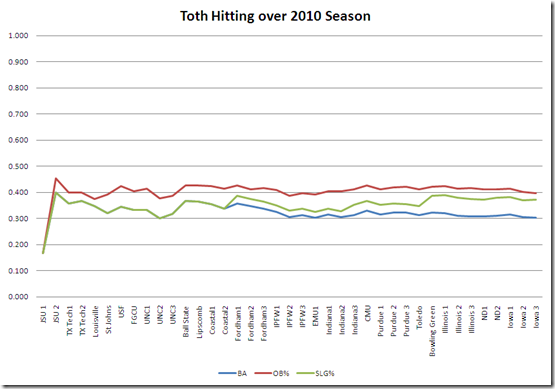
At the top of the order Biondi and Toth are on opposite paths as well. Biondi had been pretty consistent, but then came Iowa:
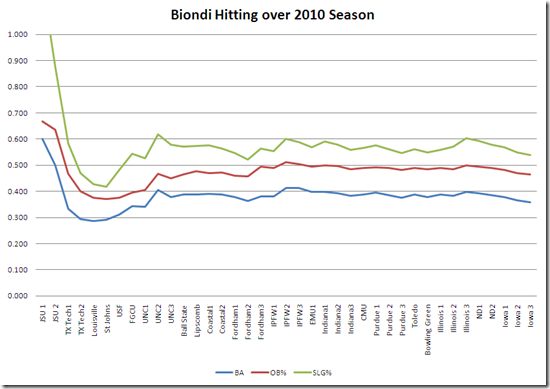 Here's hoping he's bottomed out.
I'm hoping that since he's hit a low as he's at the lowest level since the UNC series. This graph perfectly describes why Michigan struggled against Iowa last weekend. When Biondi gets shut down, our offense sputters. This isn't the time to get into a slump as Michigan hosts Ohio State this weekend. Luckily, though, for the slight drop in production from Biondi, Toth has stepped up a bit lately.
Toth hasn't been producing quite as well as Biondi, but the recent jump in slugging has been huge. Over the last two weeks, Toth has 10 RBI to lead the team. That's not something I would have ever expected. That's probably not a good sign for the offense as a whole, but it's nice to see him step up when we've needed it.
In terms of comparing players on the team, we'll look first at slugging percentage compared to at bats. (I wish the java embeds would work easily so you could play with these easier… instead, click to embiggen, data files linked at bottom)

This leads me to point back at Dufek. With his rise in strikeouts, his walk rate has dropped immensely, leading to him now leading the team in at bats. That's probably not the best case scenario for you 5/6-hole hitter. It seems especially odd with Crank still slugging quite better than Dufek (.588 versus .466). While the lineup shift appears to be an effort to spark Crank, I'm not sure it's a long-lived move.
But let's take a look at the Big Ten Conference stats only:

Here, we can see that more of the reason why Dufek was bumped in the lineup. It's been Coley Crank who has struggled a bit more in conference play from a slugging and lack of walks. For those interested in Garrett Stephens, that grand slam is one of two hits in 6 at bats. The other dark orange spot is Travis Smith who is 1/1 with a single.
The second team comparison looked at will be runners left on base against RBI produced. This visualization is meant to help understand who is getting the clutch hits as compared to who is ending innings.

Lorenz had a ridiculously poor stretch from Ball State through IPFW that saw him strand 27 runners in just 10 games, accounting for over half of his LOB in just one quarter of his games. Crank and Dufek have been pretty consistent in their LOB numbers, but but Dufek isn't creating as many RBI in conference season. As proof, the conference only visualization:

Crank may be stranding quite a few in conference play, but he's bringing in his fair share of RBI. Dufek has stranded a few less batters, but he's not knocking them in anywhere near the rate of Crank. It'll be interesting to see if Dufek can produce like he did last year as we move forward. I'm less worried about Toth's LOB numbers. He has one bigger game per weekend (2-3 LOB), but the rest of his games are generally pretty clean.
Oh, and if you couldn't tell by the above visualizations, Ryan LaMarre is doing quite fine.
Michigan vs The Big Ten
In an attempt to give some background information on how I formulated those conference predictions in the Conference Midpoint Recap, we'll look around the Big Ten and compare Michigan to the field at large. First, we'll take a look at the same three derived stats (BA, OBP, SLG%).

The teams are ordered by batting average. Michigan ranks third in batting average and on-base percentage, but they fall to fourth in slugging. Just giving the standings and this chart a once over, you can see it somewhat follows the standings, but three flaws come in when judging that. These are cumulative stats for the whole season is the first.
If we take a look at this same visualization with just Big Ten Conference stats only, things change a bit.

Sorry about the colors being so similar, but manyeyes doesn't let me change those. What we see above are teams in order of descending batting averages in Big Ten play. Michigan has the third highest slugging percentage (.468) and second in on-base percentage (.400).
But offensive numbers are only half the game. So with that in mind, let's take a look at some of the pitching statistics. So let's take a look at some of those:

Michigan is currently fourth in team ERA (all games) with a 4.93 value. Looking at team ERA, I think we have a slightly better look at the standings. Northwestern still lingers way back of their actual standings, explaining their .325 overall winning percentage. In the Big Ten season though, they've upped their batting average to .325 (from .308 overall) and their ERA is just 4.88 in Big Ten play while their overall is 5.22.
When we look at the Big Ten only statistics:

Here we see that Michigan has slipped a bit on the pitching front during conference play. Not surprising when I think back to those glorious days when Alan Oaks was money for 8 innings every start. They seem so long ago.
What I do draw from these two graphs is that Michigan only faces one more team that is in the top half of the conference in batting and pitching over the rest of the Big Ten regular season, that being Minnesota. With their Dr. Jekyll&Mr. Hyde performances, I'm not dreading that series. It definitely makes me feel like the rest of Michigan's schedule is winnable, hence my prediction in the Conference Midpoint Recap.
The last graph I want to look at is what I call the Michigan Lefty Descriptor.

I've made it pretty clear that I think Brosnahan and Katzman aren't great control pitchers, but rather "effectively wild", and while this is a team effort in this chart, I think this helps describe the situation adequately. Michigan leads the league in hit batters (50) and is tied for most wild pitches thrown (40). They also rank third in walks (151). These type of numbers drive me crazy as a fan. On the flip side, we're second in strikeouts (290) behind Purdue (312). It's just getting to those strikeouts has been tough. Pitchers not named Burgoon haven't very economical on the pitch count (see the high number of walks), and it's an area of concern.
It actually gets worse in conference season:

Michigan drops to 6th in strikeouts while they continue to lead in wild pitches and hit batters. They do retain their third place spot in walks. That's a pace that desperately needs to reverse.
Summary
Crank and Dufek are in a downward slide but appear to be bottoming out; Dufek has seen his strikeout totals balloon of late and it's reflected in his lack of Big Ten RBI and totals left on base. Biondi, on the other hand, has been straight sliding over the last week and a half. Perhaps the week off will help? Toth and Berset have both picked it up lately to compensate, plus LaMarre returned with a bang.
On the pitching front, Alan Oaks slide over the last few weeks is becoming quite noticeable. The inconsistency of our lefties isn't good either. The only redeeming fact is were about as balanced as you can get in the Big Ten after Michigan State, who has had a couple intangibles hurt their position in the standings.
Data
For those interested in looking at other raw stats, the data I used:


Comments