OSU Defense With and Without Bosa (with charts!)
The charts didn't seem to show up in my previous attempt at this diary, so I'm trying it again. There were also some math errors that have been corrected. If the mods could please delete my last attempt, that would be great. If the charts still don't show up, then I'll see myself out.
I saw this question posed in an earlier board post, so I figured I’d do a little deep dive to see what the impact has been of Nick Bosa being out of the OSU lineup for the past 8 games, and what that might mean for Michigan.
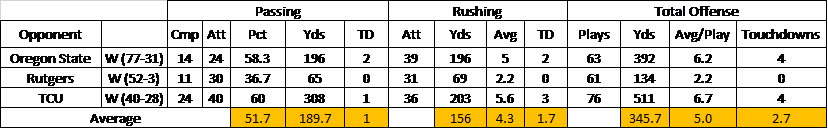
Let’s go ahead and start with some basic charts. First, OSU’s defensive performance during its first three games, when Bosa played, broken down by rushing, passing, and total defense:
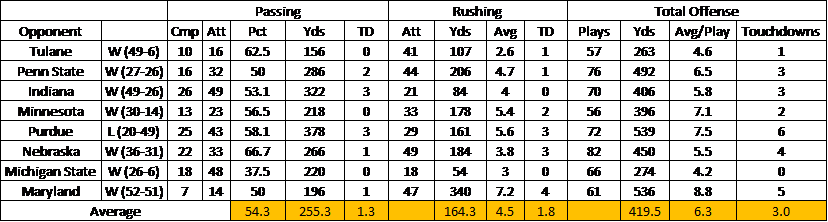
Now, let’s take a look at OSU’s defensive performance post-Bosa:
Some key takeaways after a quick review and comparison of the charts:
Passing
- OSU’s completion percentage allowed is slightly worse, but by a negligible margin. Passing TD’s allowed are basically the same.
- OSU is giving up almost 67 more passing yards per game in Bosa’s absence. This could be a function of opposing QB’s being able to hang in the pocket longer and throw farther downfield with a hampered OSU pass rush.
Rushing
- Surprisingly, almost no drop-off since Bosa’s departure. OSU is giving up about 8 more yards per game, while yards per rush and TD’s are almost unchanged.
Total Defense
- Taken in the aggregate, the news looks a little better here if you squint when looking at the numbers. OSU is giving up around 74 more yards per game, which is…ok, but nothing to get excited about. Touchdowns per game are almost the same.
Red Zone Defense
Ok, so maybe Bosa’s departure hasn’t had a major impact at first glance, but what happens when we narrow our focus to OSU’s red zone defense? Charts? Charts:
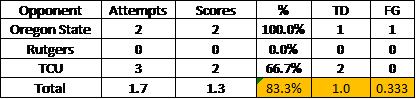
OSU with-Bosa Red Zone Defense
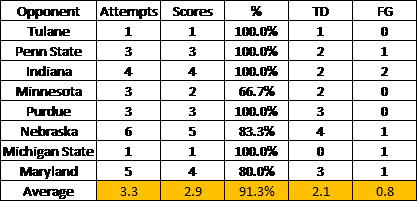
OSU Post-Bosa Red Zone Defense
Now we might be getting somewhere. Caveats about different sample sizes apply here, but a few things really jump out when comparing the numbers:
- OSU opponents are getting to the red zone more than twice as often post-Bosa.
- OSU is giving up twice as many red zone scores
- Offenses are converting in the red zone at a rate around 8 percent higher than when Bosa was in the lineup. I decided to leave FGs in the equation, since OSU's defense still ceded the yards necessary to get to the red zone and score points.
- Teams have doubled the number of red zone TD’s post-Bosa.
Now, these numbers seem encouraging, but is this a case of correlation not necessarily equaling causation? I decided to sit down and eat some tape to find out. My method was very rudimentary; basically I just watched every red zone touchdown given up by OSU this season (by far the most enjoyable part of writing this diary), to see which touchdown plays were run to Bosa’s side of the field. This was relatively simple, since Bosa lined up on the same side of the line on every snap. I counted touchdown plays that were either run directly to Bosa’s side, or plays where Bosa/his replacement pinched down and/or was blocked right out of the play.
So, what did the tape show?
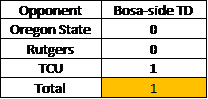
Bosa on the field Red Zone TD’s
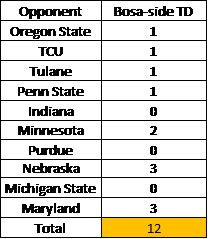
Bosa Not on the field Red Zone TD’s
Note: Oregon State scored a Bosa-side TD when he was not on the field,
and TCU scored a Bosa-side TD after his injury
Now we’re really starting to see the potential impact of Bosa not being on the field. When he was out there, OSU’s opponents managed one touchdown to his side of the line. In his absence, teams are picking on that side of OSU’s line in the red zone with increasing success.
What’s particularly noteworthy and Michigan-relevant here is the method by which Nebraska was able to target Bosa’s vacated spot on the line. Scott Frost utilized the read-option to lethal effect when the Huskers got near the end zone. Their first red zone TD was a textbook read-option that just completely froze Bosa’s replacement:
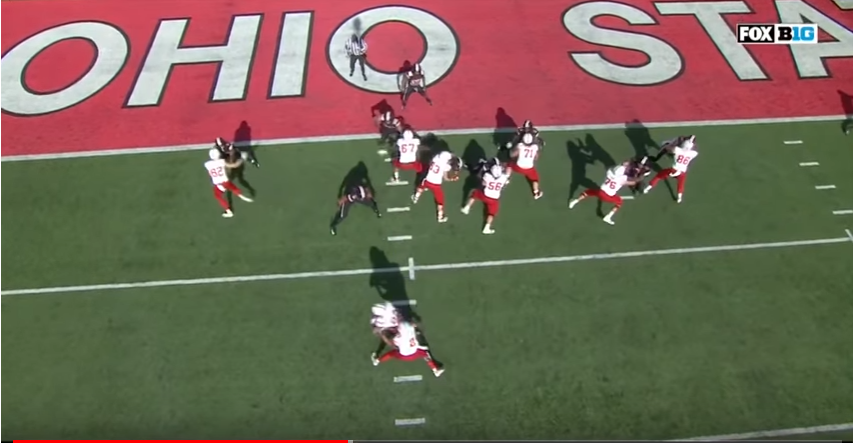
Martinez kept and scored, but the defensive end was so flat-footed that either decision would have put the ball in the end zone.
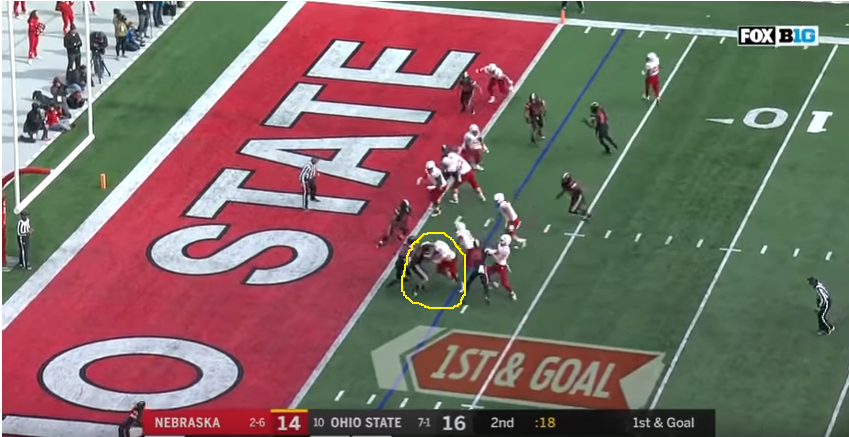
Nebraska’s next red zone touchdown was yet another read-option that Martinez kept and ran right into the hole where Bosa’s replacement (circled) was getting blown right out of the play:
Conclusion
To my amateur eye, there certainly seems to be some correlation between Bosa’s departure and a slightly decreased defensive performance on OSU’s part, especially in the red zone. My rudimentary statistical analysis doesn’t necessarily prove a rock-solid connection between the two, but there are some indicators. At the end of the day, it doesn't appear that missing Bosa has caused the OSU defense to fall apart, but it can be hard to tell since the defense wasn't all that great with him in the lineup to begin with.
As far as this Saturday, we can all cackle with knowing glee if Shea Patterson is performing crisp read-options in the red zone, right toward that glaring Bosa-sized hole in the Ohio State defensive line.
November 21st, 2018 at 11:24 AM ^
This has gotten me more excited than any other board post lately.
November 21st, 2018 at 11:43 AM ^
One thing to consider is the relative strength of the offenses faced by OSU pre- and post-Bosa. OSU hasn't exactly faced a murderer's row this season thus far, either before or after, but would perhaps rub this up against fancystats to see whether the drop correlates to, for example, the offensive S&P+ of the competition.
November 21st, 2018 at 12:07 PM ^
Agree. 33% of the “with Bosa” sample is Rutgers...
November 21st, 2018 at 12:29 PM ^
Yeah, this is kinda useless without first adjusting for each team's average offensive output (like the one about the common opponents).
November 21st, 2018 at 12:54 PM ^
Yeah, Rutger killed the average by deciding not to play football.The surprising thing to me was that Oregon State was 2 for 2 in the RZ.
November 23rd, 2018 at 9:19 AM ^
Also TCU (5-6, 98th best offense in SP+) and Oregon State (2-9, 71st), both of which are pretty terrible.
November 21st, 2018 at 11:48 AM ^
Dude, this was just posted. Literally right below yours.
All kidding aside, good insight.
November 21st, 2018 at 1:44 PM ^
Hmmm....
Sounds like zone reads and RPOs are going to be effective on Sat. That's encouraging.
November 21st, 2018 at 1:57 PM ^
First 3 offenses are among the nations worst
makes a big difference
November 21st, 2018 at 9:43 PM ^
TLDR;
Can we get an Excel plot of the change over time or something?
November 22nd, 2018 at 6:18 AM ^
I appreciate the hard work that went into this. Thanks OP.
I don’t know how meaningful it is without being opponent-adjusted, but if it stands up I think the most noteworthy insight here is the additional 75 yards per game ceded. That’s a pretty big number. Right now a team giving up the with-Bosa average of 345.7 ypg would rank #30 in total defense, whereas a team surrendering the post-Bosa figure of 419.5 ypg would rank #85.
November 22nd, 2018 at 10:33 AM ^
This is cool, thanks. Personally I'd rerun the numbers excluding Rutger. I think the comparison of opponent offense would likely be more accurate that way.
Interestingly enough, if we do that, it doesn't look like Bosa did much of anything.
Comments