Semi-Objective CFP Ranking System: 2018 Week 12

The Preface
This is is the week 12 college football team rankings produced by a semi-objective model as described previously HERE. The model was inspired by Seth's post that proposed a point system to determine bowl eligibility. These rankings aim to be a relatively objective starting point from which to apply considerations such as the eye test, margin of victory, and head-to-head results. The goal is to rank the quality of the resumes of teams from an accomplishment standpoint.
The Rules
- +3 points for a conference championship.
- +4 points for a win over a top 10 team.
- +3 points for a win over a top 25 team (not in top 10).
- +2 points for a win over a winning P5 team (not in the top 25).
- +1 point for a win over a winning G5 or a losing P5 team.
- +0 points for a win over a losing G5 or any FCS team.
- -1 point for a loss to a top 10 team.
- -2 points for a loss to a top 25 team (not in top 10).
- -3 points for a loss to a winning P5 team (not in top 25).
- -4 points for a loss to a losing P5 or any G5/FCS team.
Top 10 and top 25 status are determined by this ranking system and the model is solved iteratively until it converges. In scenarios where oscillatory states lead to a failure in convergence, the average points for oscillatory states are used. No voter polls are used in any capacity. Ties are broken by head-to-head results when applicable and RPI otherwise.
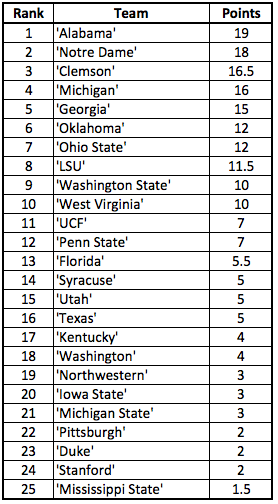
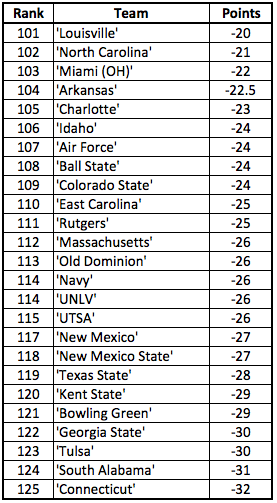
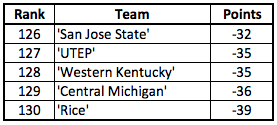
The Results
This week there were two oscillatory states, hence the 0.5 point increments.
Last week's accuracy compared to the committee's rankings:
Top 4: 75% with the one miss (5: Michigan) being 1 spot out.
Top 10: 90% with the one miss (11: Ohio State) being 1 spot out.
Top 25: 88% with the three misses (36: Iowa, 27: Iowa State, 34: Fresno State).
Alternative Method
Someone last week also suggested counting any team with the same number of points as the 10th team as top 10 (and same for top 25). I did this and compare the results below.

While the modified method improved convergence (it converged in 9 iterations), it is of course a much worse method because it moved Michigan down a spot and that is unforgivable. FYI, the modified method counts Auburn, South Carolina, and Stanford as top 25 teams.
November 13th, 2018 at 3:19 PM ^
The adjusted method seems to be a better fit for the committee's thinking, honestly, with the exception that I expect Michigan to stay ahead of Georgia based mostly on inertia. Still, when you're saying "this makes Auburn and South Carolina look better," I think -- yep, so does the committee. :)
November 13th, 2018 at 3:25 PM ^
Yeah, I was jokingly dismissing it. In actuality, I'll calculate both moving forward and see what is a better fit. If I weren't lazy, I'd go back and check previous weeks. I don't want to make arbitrary tweaks to the model to make it a better fit, but this change has some solid logic behind it.
November 13th, 2018 at 6:52 PM ^
I watched that Auburn Georgia game. Anyone who thinks one of them was a Top 10 and the other a Top 25 team after that game needs to be investigated for conflict of interest. Auburn's qb couldn't hit open receivers all game and Georgia got lucky he was so terrible. Was not impressed with either.
November 14th, 2018 at 11:22 AM ^
I think people overrate what the top of college football looks like. Of course Georgia is a top 10 team, good luck finding 4 more teams that are better than them.
Its the same thing with people bitching about where LSU is ranked or Kentucky is ranked. Who are you putting above those teams? Who is clearly better or has had better years?
November 14th, 2018 at 1:17 PM ^
Teams can also look terrible while being tough outs. Northwestern and Michigan St are teams that always try to ugly it up. They don't blow out bottom-feeders like good teams should -- hence their advanced stats suffer -- but they are hard to blow out (or even beat) because of their style (and because their defenses are very good, and their offenses are barely functional). Auburn, Mississippi St, and maybe Kentucky fit into that category this year.
November 14th, 2018 at 1:19 PM ^
I agree completely. This concept coupled with the dissonance between S&P+/FPI and season-accomplishment-resume often lead to misplaced outrage.
November 13th, 2018 at 4:01 PM ^
Are the points per victory determined by how the opponent was ranked at game time or how that team is ranked now?
November 13th, 2018 at 5:17 PM ^
Gotcha, thanks. Now if I only understood how the oscillating fan factors into things...
November 14th, 2018 at 9:15 AM ^
The model doesn't rely on polls at all: its 'top 10' and 'top 25' are this rankings top 10 and top 25. He starts off with nobody there, and then runs the calculation iteratively until the point totals don't change anymore. Sometimes you get a situation where every time you rerun the calculation, a team's point total oscillates between two values as certain teams that are right on the boundary move between two categories. Those are the oscillatory states he's talking about. When that happens, he takes the average of the possible states.
November 13th, 2018 at 5:17 PM ^
I've been diving into this stuff a bit more and I think you should consider adding home/away/neutral site data into your rankings (however you see fit). In my review, no teams in the top 10-12 teams had home losses, with the one exception being LSU vs. Bama. OU has the neutral site loss to Texas and that may be it IIRC. Teams should be heavily awarded for beating top 10 and top 25 on the road and heavily penalized for losing at home.
November 14th, 2018 at 8:46 AM ^
I've considered this and believe it has merit, but for now, the simplicity of the current rule set is very appealing if it can even sort of accurately capture the committee's priorities.
I could make a more and more complicated formula until it matches perfectly, but I think part of the benefit of this model is its use as a window into the thinking of the committee. Look at people screaming about over ranking teams like LSU, Florida, and Kentucky, yet this model has them almost perfectly on the committee's positions. That tells you that the committee is valuing resume-type things similarly to how this model does. The more complicated the model becomes, the less you can learn from the comparison, in some cases, because you can't isolate what factors are important.
November 13th, 2018 at 5:44 PM ^
This is cool and the simplicity of the system fascinates me.
What program/method are you using to iterate the ranking?
November 14th, 2018 at 8:47 AM ^
Thanks! It's just a code I wrote in Matlab that parses the data from HERE and then calculates points, sorts the team into a ranking, then repeats until the rankings stop changing (with some additional details for oscillations and tie-breaking).
November 14th, 2018 at 9:28 AM ^
It's almost like this ranking method is too good to be true, which makes me doubt it. Otherwise it makes more sense than what AP polls, BCS computers, or committees come up with based heavily on eyeball test/pre-season projection and bias. Results on the field matter above all else, imo.
I'd take it a step further and list the rankings like a PGA event. If 3 teams are tied at 7, list all three at 7, then the next team 10th. It will sort it out by the end.
In the event that an extreme scenario occurs, where and 5-6 teams prove playoff worthy (2 or 3 teams are T4), then have an expanded playoff plan in place. 5 teams, and there is a play-in game. 6 teams, the three tied teams are drawn at random, top two teams get a bye.
November 14th, 2018 at 3:32 PM ^
I go the other way, actually. I think it exposes and quantifies the hidden BS within of the playoff committee process. Its obvious that the committee is giving certain teams more credit than they've earned for reasons that are not communicated to us simpletons. Bias is bias whether there's an agenda or not.
I like this approach is because of how transparent it is. Yes, there's a huge systemic biases at play (examples: beating Rutgers is the same as beating Fresno State, beating Utah State is less valuable than beating Minnesota) but this bias is obviously an accurate reflection of what the committee and vast majority of people think anyway.
Let's play out the season the way that is broadly expected: the SEC championship game precipitates 1 of 2 possible out comes with the rest of the top 5 winning out:
- Clemson finishes with 26.5 pts.
- Michigan finishes with 26.
- Notre Dame finishes at 23.
- Alabama finishes at either 27 pts if they win in the SEC title or 20 if they lose.
- Georgia finishes with 24 pts if the beat Alabama would see them finish with 24 pts.
There's absolutely no way to rank Alabama ahead of Michigan (or Notre Dame for that matter) without them winning the SEC championship or gifting them 6.5 points... thats almost 35% boost. Hogwash, I say; the greatest team in the history of the universe should be able to either get in without such shenanigans or handle a more difficult schedule.
We have to value being undefeated at 4 points in order to vault Notre Dame ahead of Michigan, which I actually find palatable given how hard it is to do that. Knock off point for only playing 12 games instead of 13 like real teams and add a half point as a head-to-head tie breaker and the world suddenly makes sense again.
TLDR...this is good shit.
November 14th, 2018 at 5:04 PM ^
I appreciate your perspective. Conference championship week is always very important for this model's results, as it is with the committee.
One bias that I believe the committee has that this model does not attempt to capture (nor will it) is recency bias. A Bama loss to Georgia in the first game of the year wouldn't matter as much as a game which the committee could view as a play-in game. Maybe we'll see; hopefully we won't.
November 13th, 2018 at 6:25 PM ^
The modified method merely reinforces the built in SEC/ACC bias, thereby exacerbating the prejudicial effect to UM. By modifying, you're not only bumping the SEC/ACC for being on the list, but now you're artificially bumping them further by telling them that close enough is worth more.
November 14th, 2018 at 8:52 AM ^
The alternate method did benefit the SEC, though the ACC teams' points did not change at all outside of Clemson who only gained a half point because there was no oscillation, so I'm not sure you've thought out your point completely. Either way, the "bias" you refer to is just the valuation of having few losses and seems to be in line with what the committee's values. A model that captures that can tell us a lot.
November 14th, 2018 at 1:19 PM ^
If anything this rating method hurts SEC/ACC teams since they will most likely have an extra game against a G5 team. More likely than not, that win over a G5 team will count less than a win over a P5 team.
If Michigan beats Indiana this week, we will gain 1 point.
If Alabama beats the Citadel, they will receive 0 points.
If Georgia beat UMass, they will receive 0 points (independent school, but should be viewed as losing G5).
November 14th, 2018 at 1:24 PM ^
You're correct for teams that win, but it's a little more complicated for the conference as a whole. An extra week of conference games for the B1G means 7 mandatory losses that could be wins if they all had out of conference victories instead. Of course the flip is also true that there are 7 mandatory wins in that extra week that could have been out of conference losses.
As with all of cfb, the details about which teams win and against whom changes the beneficiaries.
November 14th, 2018 at 9:05 AM ^
This week's accuracy:
Top 4: 100% (yay!)
Top 10: 100% (double yay!)
Top 25: 84% with four misses (34: Boston College, 28: Utah State, 27: Cincinnati, 41: Boise State).
Despite the misses in the 20-25 range, look at how close it is for most teams in the 1-19 range. Positive numbers mean the committee ranked a team higher than the model.

November 14th, 2018 at 9:11 AM ^
Evaluating the alternate method where we used a top 10/25 point threshold:
Top 4: 75%
Top 10: 100%
Top 25: 84%
Slightly worse, but only because Georgia/Michigan flipping. I'll continue to evaluate this one in the coming weeks.
Comments