Comparison of Opponents CFP's Top 10

So I've been at work waiting for a matter to heat up and I thought I would look at some of the narratives regarding the CFP Top 10. I wanted to look at which teams have played a tougher schedule and who won these games. The results were interesting.
Based on opponent winning percentage, here are the toughest schedules based off all oppoenents current records. I put Bama and Georgia in the SEC championship game, Clemson and Pitt in the ACC, Oklahoma and WVU in the Big 12, UM, NW, and OSU in the Big 10, and WSU and Utah in the Pac 12:
Georgia (.608), Clemson (.583), UM (.577), LSU (.562), WVU (.555), Oklahoma (.551), Bama (.543), WSU (.531), ND (.521), and OSU (.485).
Here are the opponent winning percentages based on teams that a team beat. For example, this excludes ND for us and Purdue for OSU:
Georgia (.592), Clemson (.583), WVU (.545), Bama (.543), UM (.542), Oklahoma (.538), WSU (.533), ND (.521), LSU (.505), and OSU (.483).
Finally, I did the same for the power 5 opponents each of the top 10 here are those results:
Georgia (.646), LSU (.622), UM (.582), ND (.576), Clemson (.574), WVU (.569), WSU (.560), Bama (.550), Oklahoma (.533), and OSU (.483).
Here is opponent winning percentages based on P5 teams that a team beat:
Georgia (.629), ND (.576), Clemson (.574), WSU (.567), WVU (.560), LSU (.557), Bama (.550), UM (.540), Oklahoma (.515), and OSU (.482).
Lastly, I ran some rankings based on where these numbers rank among the top 10. I assigned 10 points to the best score and 1 to the worst. I used record, Opp. win %, Opp. win % in win, Opp. win % in losses, P5 Opp. win %, and P5 Opp. win % in wins. I did not include P5 Opp. win % in losses because every top 10 that lost, lost to a P5 team.
1. Clemson, Georgia (52 points); 3. ND (41 points); 4. UM (39 points); 5. Bama (38 points); 6. WVU (35 points); 7. LSU (30 points); 8. WSU (27 points); 9. Oklahoma (25 points); 10. OSU (13 points).
All the SEC schools and WSU have only played 9 P5 opponents, Clemson, ND, UM, OU have played 10 P5 opponents, and WVU and OSU have played 11.
I apologize for the formatting, but the spreadsheet wouldn't upload. I plan to update this weekly over the rest of the season until the final rankings come out. All comments/questions/suggestions are welcome in the comments.
November 13th, 2018 at 2:12 PM ^
I should add too, this wasn't meant to be a definitive rankings of teams, but rather a comparison of schedules. OSU and ND haven't played anyone. In fact, if you remove UM from ND's numbers, ND's opponent win % is .486.
November 13th, 2018 at 10:01 PM ^
ND hasn't played anyone?
November 14th, 2018 at 5:07 PM ^
This is kinda tough to assess. They beat us, the #4 team in the country, Stanford and NW, both good but not great teams, and now they have Syracuse, another good, not great team...assuming they win, that is three wins against good teams and one win against a great team. Just subjectively, I see them as the 6th best team right now, we'd beat them in a rematch and I see Georgia, OU, and maybe WSU handling them as well.
November 15th, 2018 at 8:00 AM ^
I think you're showing a bias toward flash and scoring, and against defense. There is no way WSU can beat ND. ND is a team that efficiently grinds out wins by playing good defense and enough offense to win. They're not flashy, but they would clamp down on WSU and probably OU also (look at OU's close calls). Teams like ND that lack pizzazz are so often underestimated. They're schedule has been pretty reasonable, and they've barely been challenged. We were pretty lucky to even be close against them, and didn't really have much shot to win- long shot at best driving to tie at the end. We'd beat them now, 6/10 times. But it takes a lot to be 10-0 when you're ND, and everyone gets up to play you. They are a top 4 team, if not top 2. I think they'd be even odds to beat Clemson.
November 13th, 2018 at 2:23 PM ^
I couldn't find it in your description, but did you make any adjustments for playing FCS opponents?
November 13th, 2018 at 2:37 PM ^
I didn't adjust FBS vs. FCS. The FCS opponents would be removed from the P5 numbers though.
November 13th, 2018 at 3:02 PM ^
I'm curious, are you doing this in an automated manner? If so, it would be helpful to see how these metrics expand into the entire 130 team field to give context to the top 10 results.
Additionally, your point system accentuates the differences between the top and bottom teams. You're using 6 methods to determine points, but 5 of those methods include many of the same data points. In other words, you're minimizing the contribution of the record part of your analysis by diluting it with opponent win% times 5. For example, if you think opponent win%, opponent win% in wins, and opponent win% in losses as three metrics combined is three times more important than record, then this approach is fine; but that doesn't seem true to me.
November 13th, 2018 at 3:39 PM ^
It's interesting that in this diary and Maizer's semi-objective system there's clearly a top tier of 5 teams (Clemson, Alabama, Georgia, ND, and Michigan). I'm honestly surprised that Clemson is so highly rated here, but maybe that's more evidence to support the CFP committee's favoritism towards ACC schools?
November 13th, 2018 at 4:17 PM ^
Both metrics are rewarding the same thing: the ACC has a bunch of teams with few losses (six teams have 3 or fewer losses; in comparison the B1G only has three such teams).
November 13th, 2018 at 7:19 PM ^
This seems like an overly simplistic way to measure strength of schedule.
The first problem is that it gives the SEC a distinct advantage over the other conferences. They play 4 non-conference games, while the others play 3. The extra game is almost always a cupcake, so their conference opponents have an extra .5 wins on average.
The second is that the Big Ten is at a clear disadvantage as it plays far fewer FCS opponents than the other conferences. There was only one this season, a late scheduled replacement game for Nebraska. Weaker teams in other conferences have an easier way to pump up their records
Third is counting games against teams at different levels the same. There's a substantial difference between playing a 6-6 Power 5 opponent, a 6-6 Sunbelt team and a 6-6 FCS team. There's a substantial difference between playing a 9-3 Power 5 team and a 3-9 Power 5 team. There's much less difference for a CFP contender between playing a 9-3 MAC team vs a 3-9 one.
I'm not suggesting an easy fix. I don't think there is any way using arithmetic to fairly measure strength of schedule. It's too complicated for that.
November 13th, 2018 at 9:27 PM ^
So this indicates that Alabama will miss the CFP if they lose to Georgia since they beat a bunch of cupcakes and they didn't win their conference.
November 14th, 2018 at 11:50 AM ^
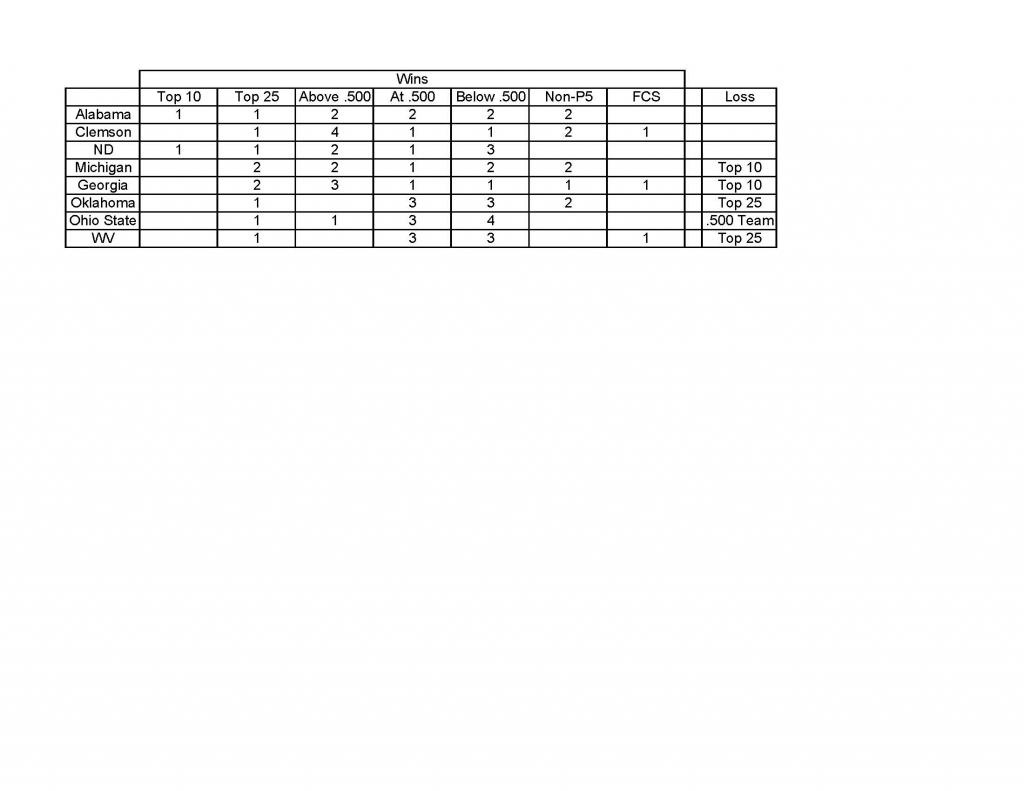
I did a quick summary of the wins/losses of the top 8 teams based on the current record and/or standing of their opponent. For this summary, I didn't differentiate between the record of any non-P5 (ex ND team). Can clearly see a line in the sand after Georgia, but not much differentiating the strength of the opponents between the top 5.
November 14th, 2018 at 12:58 PM ^
Can you remove all FCS results from every team? So beating FBS Arkansas St is not beating a 5-5 team, it is beating a 1-5 team (reflecting only their FBS games)
November 14th, 2018 at 1:25 PM ^
Wow, that's another notch in favor of making FCS/FBS matchups disallowed.
November 15th, 2018 at 11:41 AM ^
I believe:
All FCS wins should be removed from every team
Points should be granted to an opponent for:
- FBS Wins
- Bonus points for each FBS victory the opponent has
- Additional Bonus Points for beating a Power 5 or independant team (ND, Army, BYU etc)
- Additional Points for a road win
- And Additional Bonus points for expected win results vs each opponent based upon game stats (so a dominant win is recognized) - Second-Order Wins: Defined here and discussed in further detail here and here, second-order wins compare the advanced statistical components of a given game, and the single-game win expectancy they create, to the actual results of the game.
Comments