Turnovers a la Marty McFly
I don’t practice Santeria. I ain’t got no crystal ball. I had a million dollars but I … I “spent” it all.
-Sublime, Santeria
In an obscure part of Jim Mora's famous playoffs(?!?) presser, he gave the sports world the skinny on turnovers: "I don't care who you play--whether it be a high school team, a junior college team, a college team, much less an NFL team --when you turn the ball over 5 times...you ain't gon' beat anybody I just talked about. Anybody.” We all understand this via basic football intuition (ahem) but, stick around if you care to see if we can stick a number on that intuition.
Plenty of previous work on the subject has been done by many folks including myself. Football Study Hall recently conducted a study in similar fashion to how I’ve done it in the Blue Moon stuff and estimated the effect of per game turnover margin on season win percentage. FSH’s look lines up with the BMM, both suggesting that the gain on Season Win Percentage for per game Net TOM is about 100 basis points. The effect on overall record is useful but when watching a singular football game we’re not thinking about the whole season; we’re only thinking about the next few hours or so. How do the turnovers within a game affect the outcome of that specific game? To answer the question we’ll have to use math skills that go beyond grouping, counting, and arithmetic.
Crank that Soulja Boy Huey Lewis MC Hammer. Wha?
2 Logit 2 Quit*
 To answer the question at hand you need special math. In this situation you need to estimate probabilities because the outcome of a single football game is categorical (specifically binary) rather than discrete as in the case of full season wins. Herm Edwards gets it: “This is what’s great about sports …you play to win the game. [/Pitch Perfect Cumong, Man Glare]. Hellooo? You play, to win, The Game.” The point of sports is to beat Ohio State. Herm gets it. /Michigan orthodoxy
The special math is called Logistic Regression. It’s still a kind of linear regression but that regression is run through what is known as a link function to deal with the binary nature of the thing being modeled. This is done in all kinds of technical fields but for sports, um, investors this is a particularly nifty trick to have stashed next to your rabbit’s foot. The data for the model comes from NCAA.org as always. Sorry, no coefficients this time but I’ll show you a—
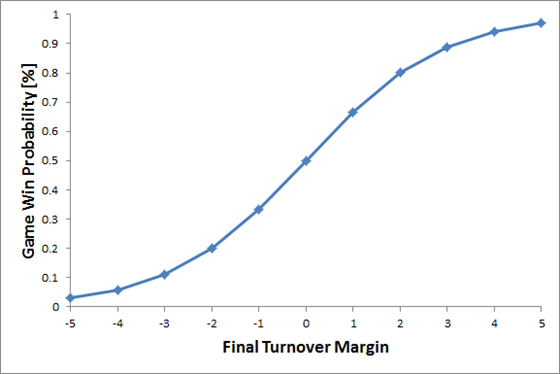
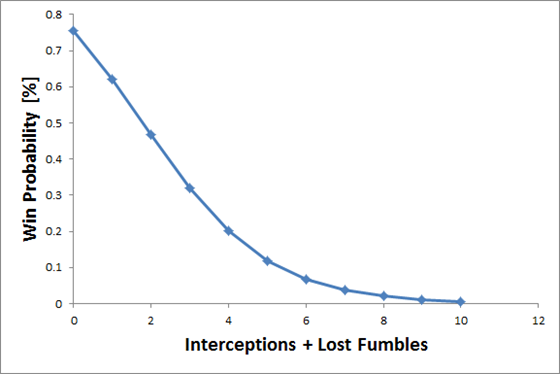
Here’s a useful way to think about this chart: suppose we were to play a Sunday morning game where I told you a team’s Final Turnover Margin and you had to tell me if they won the game or not—what would the payout odds need to look like for you to break even? This chart is the first step in answering that question.
Several features on this chart stand out to lend intuitive validity to the model. First there is neutral win probability at neutral TOM. Second, negative TOM hurts your odds, positive TOM helps them. Third, there are diminishing returns. By the time you get to +/- 3 in final TOM, the next turn over for/against you doesn’t affect win probability that much.
----
*DO NOT MISS THAT LINK. Grab a drink because its MC Hammer’s 15 minute (yezzir!) extended length 2 Legit 2 Quit video. The word epic gets tossed around a lot these days but it’s the only appropriate word to use here. BiSB, you’d dig it the most. It’s like a mockumentary / old school kung fu movie / ridiculous dance video. The hairdos, man. And the cameos: Marky Mark, EAZY E(!!!), Queen Latifah, Milli Vanilli, James M--F--in Brown in full regalia with full on wizard abilities, Hammer's Wang, Jose Canseco, Isaiah Thomas, Kirby Pucket, Jerry Rice, Ricky Henderson, Deion Sanders, Andre Rison, Roger Clemens, Roger Craig, Ronnie Lott, , and Jerry Glanville. And that’s not all of them. Epic, man. Epic.
----
What’s Wrong, McFly?
Here’s the rub though, actually there are two rubs. First, that curve represents a generic team facing a generic opponent and neither of these things actually exist. I’ve used this example before but its worth a reprise: the generic US household has something like 2.4 children in it, but show me a household with 2.4 kids in it and I’ll show you a crime scene. Real football games are played by real football teams and they’re not all created equal. That curve shifts and bends according to the strengths of the teams in the contest. For reference, the math says “Nick Saban’s Alabama” can survive a –3 TOM against the nameless faceless generic team before it’s a coin flip situation. Let that sink in for a minute. Personally, I think that might be an underestimate.
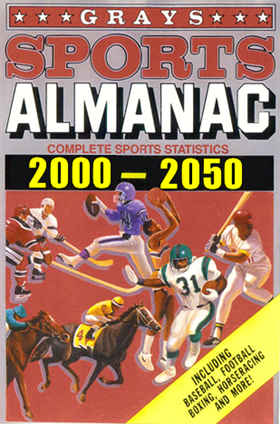 So what’s the second rub? It’s related to the first one, actually. Here’s where our man Marty McFly comes in. I broke a major rule of predictive analytics to create this chart, I gave the model knowledge of the future. That’s a no-no for models that are supposed to be predictive because, duh. Don't give me that look, I told you I was a sinner last time. Deal with it. In addition to Final TOM and Game Outcome, I fed the model an end of season strength rating as well.
.
yes
.
That disclosure may spawn some skeptics and I welcome thoughtful discourse, but allow me to explain myself before you tar and feather me. I think we’re OK to do this for the specific goals at hand. Remember, the goal here isn’t to create a predictive model, it is to estimate as closely as possible the impact of Final Turnover Margin on Win probability. On the chart shown previously, you can’t make an evenly matched game a toss-up unless you know for certain that the teams are evenly matched, right? The final strength ratings serve as a discount mechanism to let the computer know “look man, we’re talking about Oregon vs. Colorado here…the Buffs are going to need a lot of help to have ANY shot.”
Here’s another and more specific example from the past but closer to home: Michigan vs. Toledo 2008. Going into the game, Michigan was a 17 point favorite. “This is Michigan vs. Toledo, fergodsakes.” Um, no, Biff, it was Michigan **2008** vs. Toldeo. If you had read the almanac you would know that Michigan 2008 couldn’t lay points on anybody. Why the hell did you risk your existence in space-time if you weren’t even going to read the damn thing?
Turnovers Are What We Thought They Were
(I can’t do Jim and Herm and not do Denny. Its the rules).
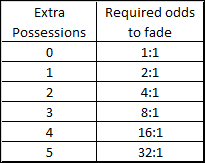 So, now that we know what that chart is and what it cannot be, what does it tell us? Well, it says that turnovers are kind of a big deal, bro. How big a deal? The first extra possession is worth 16% in Win Probability. Basically, you’d need 2:1 odds in our little game to bet against the team with +1 TOM at the end of their game . In fact, in the generic case, its a simple equation: y = 2^x.
Sans The KNOWLEDGE, we would significantly under estimate the required odds by an increasing amount with each step away from neutral. Yes, I did the math the right way too, don’t worry about it, it’s irrelevant.
News Flash: we lack The KNOWLEDGE at several junctures. First the curve needs to be adjusted according to the true strength of both teams. You wont know how good each team actually is until they are done with their schedule—and maybe not even then—so, you’ll always have an error in your estimation for one or both teams. That error is lethal over the long run.
Second, and this is a biggie, you can’t consistently predict Final TOM. Both teams are in active competition to cause and avoid turnovers. Sure, if there’s a significant mismatch between the two teams, then you might be able to get a good guess in. But then, the end effect of turnovers go down as the rating gap increases so…well, let it suffice to say that there’s an error which is convoluted within an error.
Oy vey.
Taking Destiny by the Bit
[Author note: this bit requires further discussion, please share your thoughts.]
Before I wrap this up, I need to talk about one more thing. TOM is one of those things, man. It’s out of your control. Try as they may, the defense can not expect to to get turnovers. They can try to provide the conditions necessary for turnovers to occur but they cannot make them happen. If a QB makes good decisions, no interceptions. If the ball carriers are Mike Harty, no fumble opportunities. Even if they aren't Mike Harty, you *might* be able to force fumble opportunities but you can’t guarantee a fumble recovery. You can try as hard as you can and still come up empty.
The offense however…seems like the offense can expect to not ever turn the ball over. Don't throw a pick, don’t drop a live ball, out scrap a guy for a loose live ball if you do lose your mind and drop it. You have agency in those things even if your opponent is trying as hard as they can.
So, screw TOM. Put the onus on the offense to not turn the ball over and then see what happens…Let me show you another—
I think this chart is astounding. Basically, it says that a generic team can cough the ball up twice to a par competitor and not hurt it’s win probability in any significant way. Eliminate turnovers completely (again, generic on generic) and you can lay 3:1. Cough it up once and lay 3:2 (ish). Actually, what this really says is that the typical team gives up two turnovers in a game against an equally matched opponent.
Interceptions are the Worst
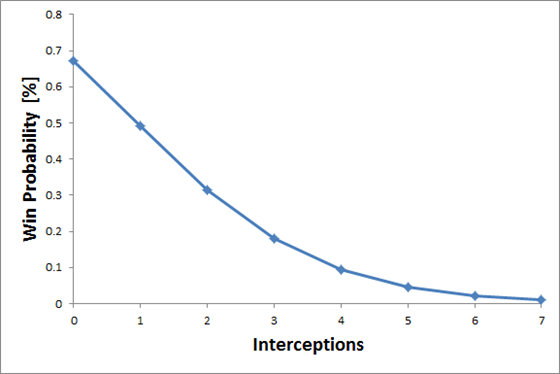
This is bogue to QBs but the data don't lie:
Again this curve shifts and flexes depending on several factors but that’s the generic shape right there.If you’re up against a par opponent, your QB is “allowed” 1 mistake before he puts the team in a bad spot. Generic-vs-generic, the team that throws no INTs, wins 75% of the time. Which team will do that? What if they both do that?
 Absent from this analysis is the timing of the turnover which is of course critical to its specific effect on the outcome of a game (Anthony Thomas fumble v. Northwestern). If that’s what you’re interested in, The Mathlete is your man.
I write this often because its important to remember: football is not a math test. Your game thesis could be dead to rights down to the weather forecast and you’ll still feel the break, feel the break, feeeel the break (/Santeria) very often. Often the decision comes down to believing in things you don't understand and/or can’t necessarily prove—not guilty and innocent are different things. Failure to reject the null hypothesis is not rejection of the alternate hypothesis. The rooting interest often defies logic and reasoning but that's what makes it so damn entertaining to have.
Welcome back to football.
August 29th, 2013 at 12:24 PM ^
Those charts are pretty nice to look at in addition to being informative.
Also good to see the word "bogue" has survived the decade.
August 29th, 2013 at 12:24 PM ^
Excellent analysis. This feels like the gauntlet has been thrown down between you and the Mathlete!
I want to see some trash talk, nerd style! (said with affection, not derision)
August 29th, 2013 at 12:29 PM ^

This is how I feel when I try to predict turnovers (yeah, I just give up trying).
August 30th, 2013 at 8:08 AM ^
"Bogue", back to the future references, MC Hammer? Is someone a nostalgic 36 year old or what?
August 30th, 2013 at 12:41 PM ^
what can I say, man, a theme's a theme. Good guess on the age but not quite.
August 31st, 2013 at 3:34 PM ^
my buddy's step-mother makes $85/hour on the computer. She has been unemployed for six months but last month her paycheck was $17025 just working on the computer for a few hours. her response
www.JAM30.com

Comments