APR And Big Ten Football: A High-Level Summary
APR AND BIG TEN FOOTBALL: A HIGH LEVEL SURVEY
SOME NOTES FIRST…
A few threads lately have touched on the subject of the Academic Progress Rate (APR) and where Michigan has been at in the recent past, but I thought it would be even more interesting to take a look at the entire Big Ten over the last several years. As it might garner the most interest, I chose to compare football programs.
I will first say that there was an interesting quandary that presented itself in collecting this data. It is simple enough to look up the rolling averages for the past eight years, but the reports published by the NCAA only had the individual team APR for four years prior, so I had to recreate the formula for finding the individual APRs using the rolling averages and I went back as far as 2004-05. I double checked my results and they seem reasonable.
ACADEMIC PROGRESS RATE:
Here is what we’re measuring when we talk about the Academic Progress Rate of a team.
For a given team, each student receiving aid will receive one point for retention (staying in school) and one point for remaining eligible to play. So, for a football team in Division I that is fielding the full complement of 85 scholarship athletes, there are a possible 170 points. If you have in a given year, for example, four players who drop out and are ineligible (subtract 8 points), and two players who remain but are merely ineligible (subtract 2 points), you would have (160 / 170)*1000 or an APR of 941.
It is also important to note that, when we enter the new championship structure, teams must earn a 930 four-year minimum average or a 940 for last two seasons to be eligible to participate in the championships. In 2015-16, it will simply be the 930 rolling average as the benchmark for participation. So, if you look at this from the perspective of how many “points” do you lose to get to 930, 93% of 170 is 158.1, so say, 159 or 11 points.
Of course, it is a metric, and the manner in which teams keep players in school and eligible can always be debated. It isn’t perfect by any means, but it is an interesting measure as it stands.
ROLLING AVERAGES:
First, here is the table with the rolling averages (thumbnail is due to size of original):
There’s not a lot to say other than the general trend is towards improvement for almost everyone. As it is a rolling average, it does hide some intriguing variations between individual years, but you can see that the conference as a whole is generally getting better.
INDIVIDUAL APRs:
In the table below, you’ll see the individual team APRs, some of which were found algebraically as I mentioned.
The average of the individual APRs for football for the conference (including Nebraska when appropriate) is 957, but I have shaded in this table the instance of APRs below 957 so you can see which teams have missed that mark and how often. Northwestern, Indiana, Ohio State, Penn State and Wisconsin would come out as APR winners in this analysis if there were such a prize.
Here’s another way to look at it, however. This table shows team performance (by way of cool shading) the performance of individual teams against the yearly conference average of those individual APRs. The far right column is the conference average, and the bottom row is the school average in that period.
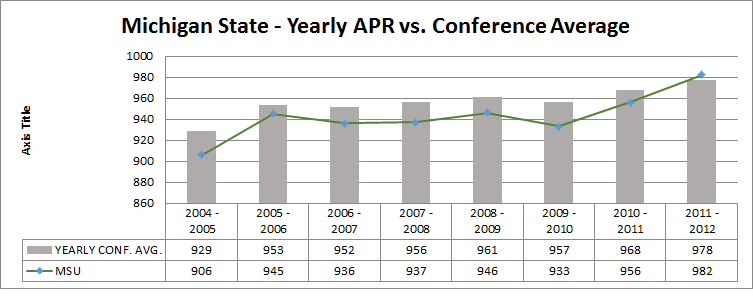
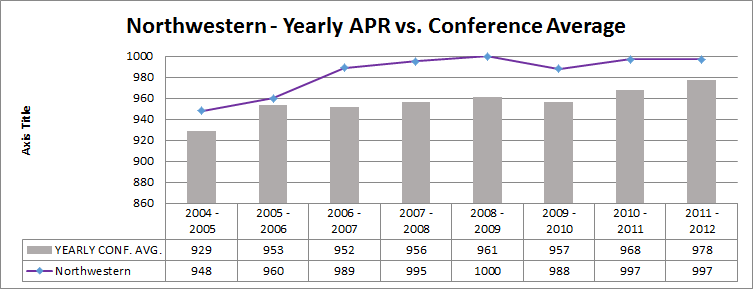
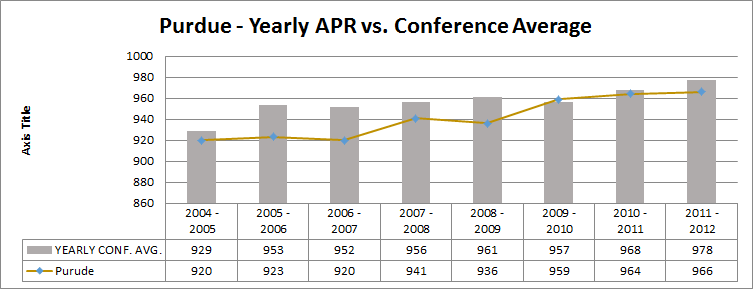
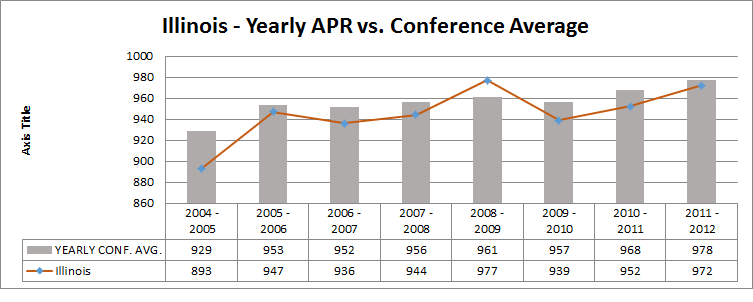
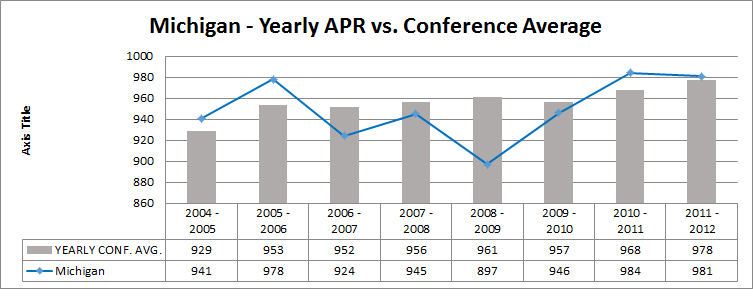
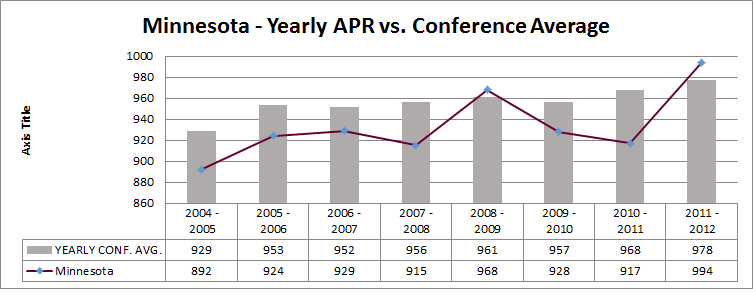
The one that should immediately grab attention is Minnesota, of course, followed to a lesser extent by Purdue, Illinois and Michigan State. These schools seemed spend a majority of this period at or below the conference average for individual APR in a given year. Michigan had a bad stretch there but you can see the tremendous improvement in recent years. Northwestern should not shock anyone really. Ohio State does well in this analysis as well.
ANOTHER VIEW OF IT:
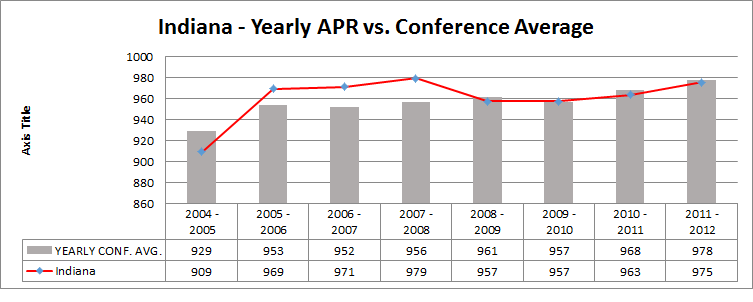
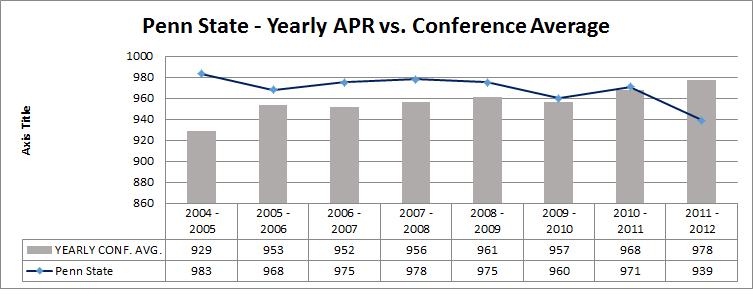
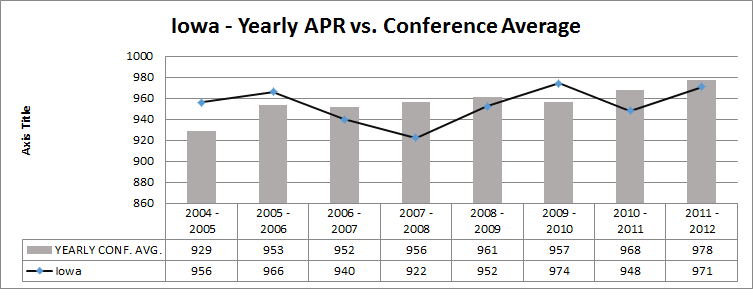
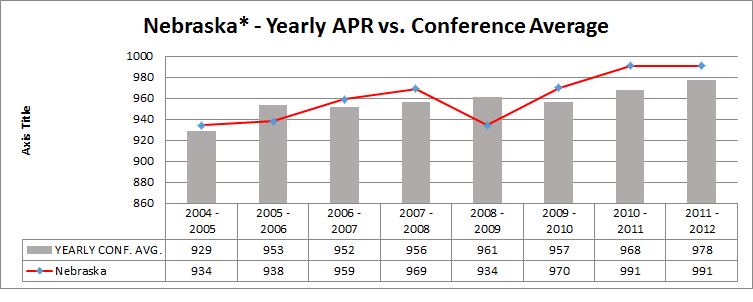
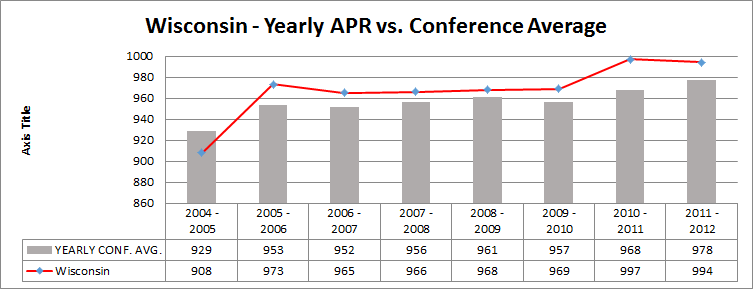
Here is a cleaner view of individual team performance versus the average:
TL;DR CONCLUSION:
Again, part of the analysis was actually trying to extract information through algebraic means, so if I did all that right and I am not just deluding myself with regards to my math skills, you should now have a somewhat clear view of where the Big Ten has been and where it is headed when it comes to the measure. Whatever you may think of it as a tool, there has been a net increase of 5.06% in the Big Ten’s average yearly score over these last eight years. When you think of how many more student-athletes that may very well mean are completing their education, the effort inside the Big Ten to drive achievement is yielding results.
OH, AND OF COURSE...

...done, Lorne. As you noted, everyone save PSU is doing well and they're situation is unique. Differences here are about splitting hairs.
Can you (or someone knowledgble) explain how things like transfers, medical schollies, or just plain quitting the program (but remaining enrolled in classes), early declaration for NFL draft, etc affects APR?
Transfers to another school is counted against the school (-2 points?) but leaving early to the NFL do not if they would've have been eligible to play.
I, too, had gone and built the spreadsheet of the available average data and charted the schools all together, where you can certainly see the general upward trend of all of them (if you measure something, folks will likely optimize operations to improve the thing you are measuring). But I lost steam before working the reverse engineering to get the year by year APR scores, so this is great.
Note, Minnesota is the only team in the B1G in this timeframe to get penalized for not hitting the APR requirements.
| 2007 - 2008 | 915 | Immediate Penalty - Scholarship Reduction = 3 |
Thanks for doing the work. It is nice to see it actually explained, something which neither the NCAA or anyone in the Media ever does.


Comments