Using Rivals Star Ratings: The SEC Comparison
USING RIVALS STAR RATINGS: THE SEC
In keeping with this for one more diary, I thought it might be interesting to take a look that conference to the south and run the SEC through a similar analysis. I will, however, compare this with some of the findings from the Big Ten analysis (full entry HERE)
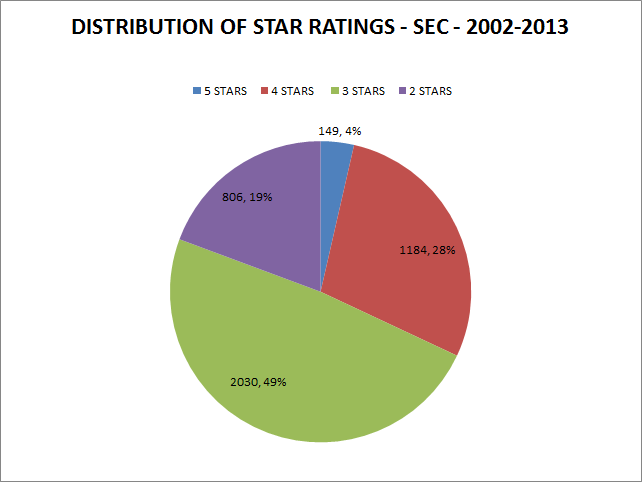
As you may recall, the folks at Rivals rated 3,160 players from 2002 to 2013. As you may expect, the number is actually somewhat higher in the SEC; in fact, it is higher by slightly over 1,000 at 4,169. Here is what the overall distribution looks like:
Now, in the Big Ten analysis, 29% of players were rated as 2-stars, and only 19% were rated as 4-stars, so in these two ratings, there is a significant gap between the SEC and Big Ten ratings. The distribution of 3-stars is fairly similar (50% in the Big Ten to 49% here), but as this appears to be the rating around which averages hover, that is probably expected. The distribution of 5-stars (only 2% in the Big Ten) isn’t too far off, but it should be noted that the 4% above represents 149 players to the Big Ten’s 50 players.
The overall conference average for Rivals star ratings in the SEC turns out to be 3.16, compared to the average in the Big Ten, which was 2.93. I was actually impressed that the difference between the two numbers is only about 7%. Of course, there is also this (I included Missouri and Texas A&M in the SEC averages for giggles):
|
YEAR |
BIG TEN CONF. AVERAGE |
SEC CONF. AVERAGE |
|
2002 |
2.84 |
3.13 |
|
2003 |
2.88 |
3.07 |
|
2004 |
2.70 |
2.84 |
|
2005 |
2.91 |
3.01 |
|
2006 |
2.89 |
3.12 |
|
2007 |
2.99 |
3.17 |
|
2008 |
2.89 |
3.06 |
|
2009 |
3.01 |
3.32 |
|
2010 |
2.98 |
3.26 |
|
2011 |
3.01 |
3.29 |
|
2012 |
3.03 |
3.29 |
|
2013 |
3.05 |
3.36 |
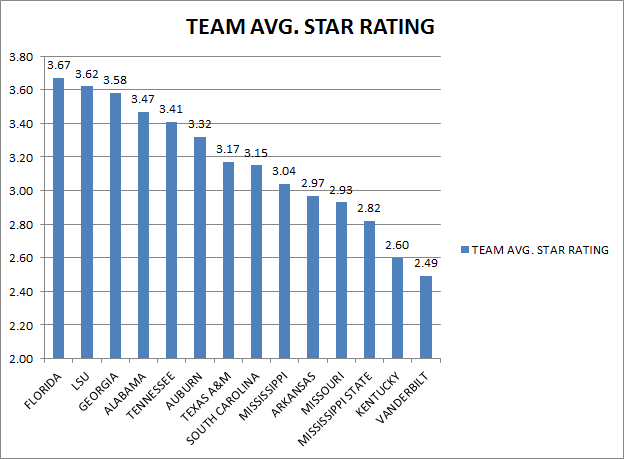
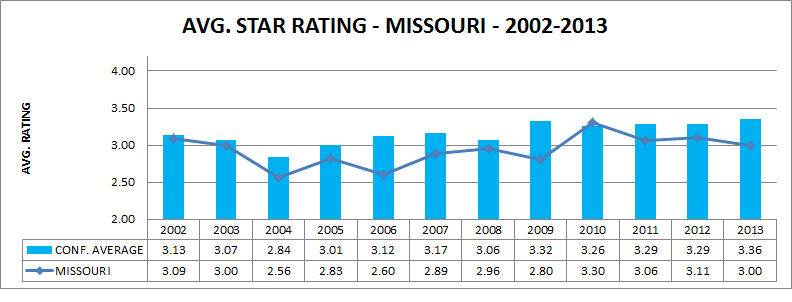
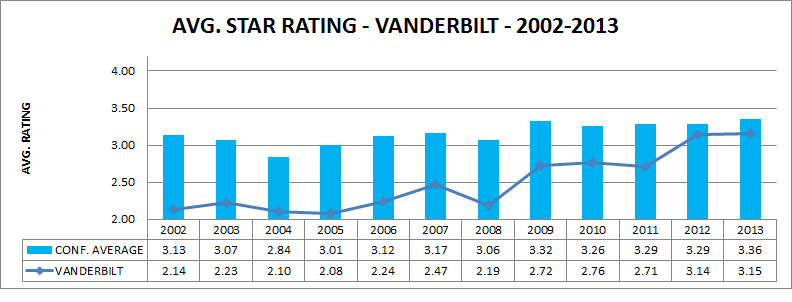
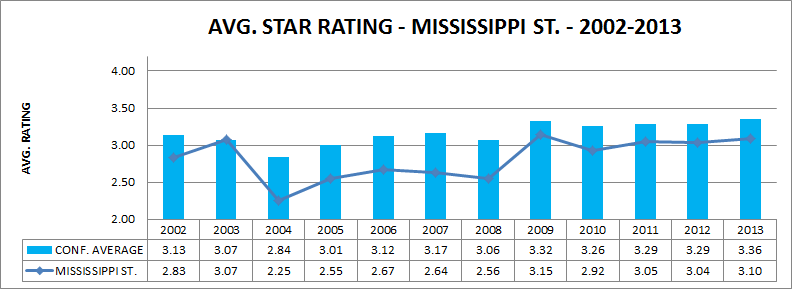
With the exception of a few years, the gap year-to-year stays comfortably in the 7-9% range, so perhaps I shouldn’t be so shocked after all. Here is what the team averages look like on a cool bar graph:
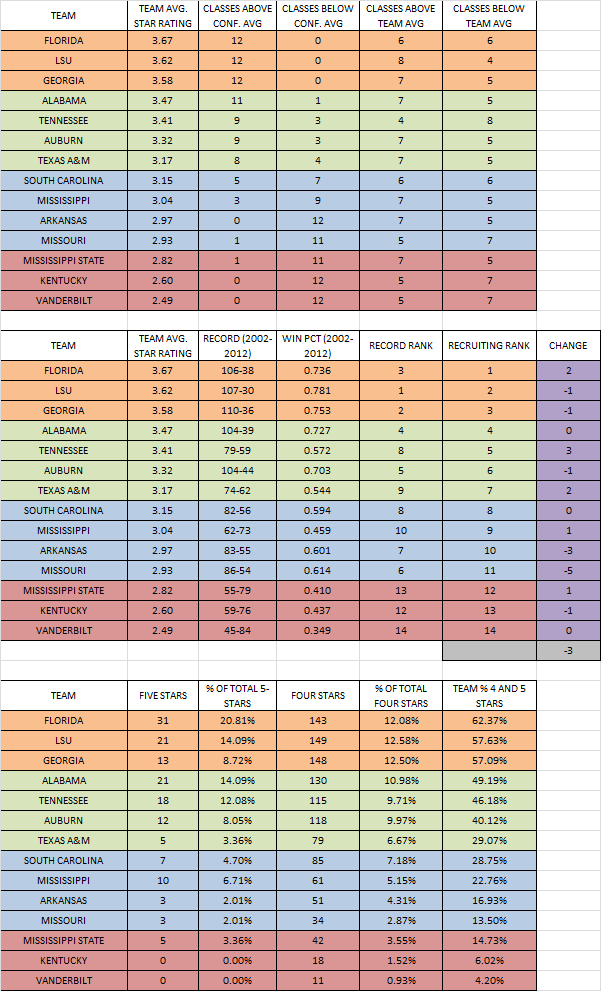
One other thing I did here is highlight through the use of random colors the quartiles of recruiting in the SEC, as you can see in the tables below:
Orange represents the top quartile of SEC recruiting – if you did a similar analysis in the Big Ten, this would be where Ohio State, Michigan and Nebraska would sit. Green is the second quartile, and you will note the presence of Alabama in this one, albeit at the top – that would be “The Shula Effect”, for the most part. In the Big Ten, this would translate to Penn State, Michigan State and Wisconsin. Blue is the third quartile, or basically teams that sit comfortably below historic conference averages, which in the Big Ten would be Iowa, Illinois and Purdue using the same criteria. Red indicates the straggler and cellar dwellers, of course, at east when it comes to average star ratings (not necessarily record, though there is some correlation). In the Big Ten, the lowest averages belonged to Indiana, Northwestern and Minnesota.
In the second table, you can see how the recruiting rank relates to the team win percentage in the 2002-2012 period. I included Texas A&M and Missouri here just to see if anything interesting would happen despite the fact that these teams have exactly one season of SEC tradition under their belts. Missouri had the 11thhighest average, but the 6thbest record, and on the other side of things, Tennessee has the 5thhighest average, but the 8thbest record. There are three teams – Alabama, South Carolina and Vanderbilt, where the rankings matched.
The third table is where the quartiles and the analysis seem to achieve an interesting consistency. What you see there is the number of five stars and the percent of the conference total, as well as the number of four star and the percent of the conference total. The last column shows you what percentage of the team’s total number of ranked recruits have either five or four star ratings. One thing that is interesting here is the relatively more even (relatively being key here) distribution you see when compared to the Big Ten. As you might recall from the Big Ten analysis 60% of all five star recruits in the Big Ten went to either Michigan or Ohio State, as well as 42% of the four star recruits. Here, it is expand roughly to four schools – LSU, Georgia, Florida and Alabama – getting more or less those percentages combined (more precisely, 58% of five-stars ended up at one of those four, as well as 48% of four-stars).
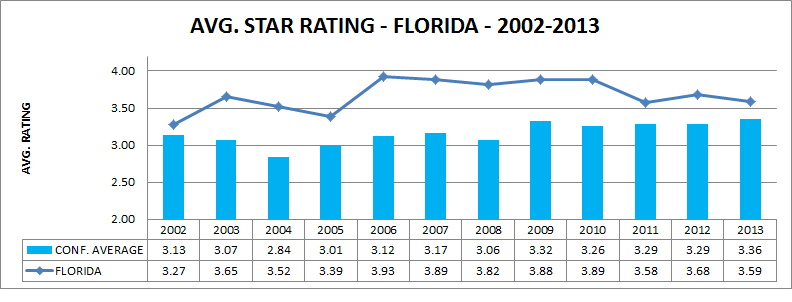
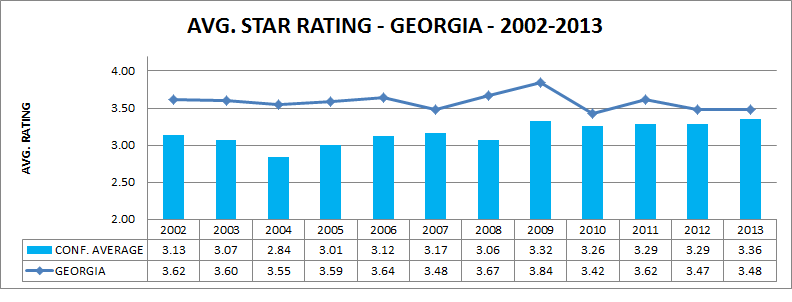
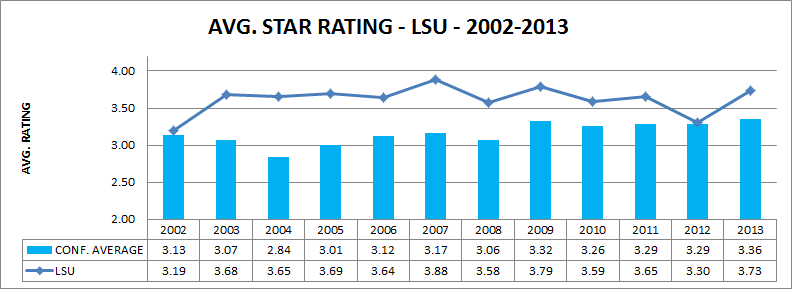
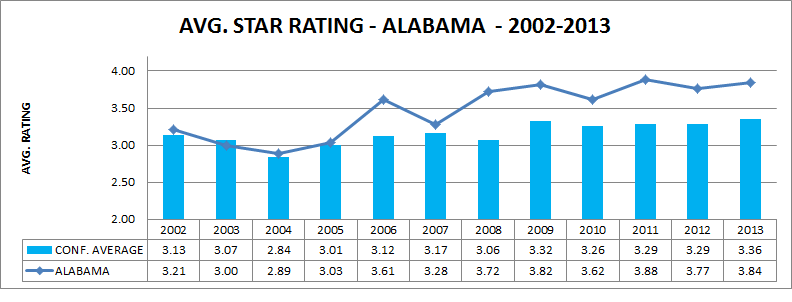
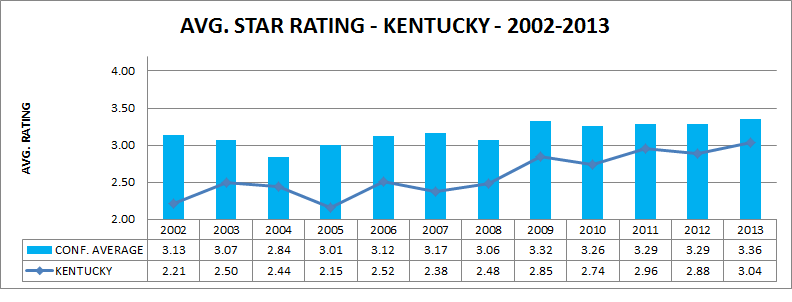
Unlike the Big Ten, I won’t put all the individual tracking here, but below are the four best and four worst compared to the conference average:
TL;DR CONCLUSION:
I really decided to do this companion diary to find differences in how conferences might get treated, so the SEC and all of its associated hype seemed a logical choice.
OBLIGATORY:

Great comparison. I'd argue that recruiting rankings are flawed, as the can be swayed by which schools offer. But it's still interesting to see the size of the gap between the conferences.
LSA - here's an idea on a diary if you're hankering for ideas Grab the 2-deep from all (some of) the schools in or out of conference and use a weighted metric (heavier for starters) to come up with a STAR FACTOR rating for the team. Then compare how teams of differing STAR FACTOR ratings do when they play each other. I'd love to see that data...
isn't the issue that the percentage of each class of recruits essentially is the same as the B1G (or close enough) but that the SEC is signing more of them b/c of oversigning?
As a sidebar, I should have put some of the class size information in the main entry, but it is interesting enough to warrant a mention.
Overall, the average class size in the Big Ten in this period was 22 players, and in the SEC, it was 25 players. What is more interesting is the variation -
In 144 possible classes, a Big Ten team has taken more than 25 only 24 times. In 168 possible classes, an SEC team has taken more than 25 players on 73 occasions, which is abour 46% of the time.
For the Big Ten in that period, the minimum value is 11 and the maximum was 31, with the standard deviation being 3.59. In the SEC, the smallest class in that timeframe was 13 and the largest was 36, with the standard deviation being 4.05.
Sadly this is what I would have assumed is the difference between the B1G and the SEC over the past 10+ years. Once you factor in the issue of 14 teams vs 12 teams in your comparison you can sum it up in two basic points:
1) Once you account for truly elite (5 stars) and the bread and butter (3 stars) The SEC gets 4 star talent and the B1G gets 2 star talent.
2) The SEC only gets 2% more of the truly elite, but that can be a big difference. Think of the '97 team without Woodson or the '91 team without Howard. Still good teams, but those 1 or 2 elite players make a big difference. The top SEC teams are getting those extra 1 or 2 difference makers vs the B1G's 0 or 1 on a regular basis.
You can stay close, but you can't "out coach/program" your way from that talent difference. This is why the B1G can stay close in the bowl and OOC games, but always seem to come up just short. Throw in a few outright beatings and it's no surprise the shine on the SEC is so bright while the shine on the B1G is fading.
Combine this with Brian's front page post today and sadly, Urban may be right. The B1G needs to improve it's recruiting across the board, not just at the top.
it really seems as if success in the SEC is tied more closely to recruiting rankings than they are tied together in the Big Ten. Both WI and MSU have outperformed their recruiting rankings for the last five years or so. NW too, maybe more recently. But in the SEC, Alabama, LSU, Georgia and Florida have pretty much dominated. When Florida's numbers were better earlier in the time period, they were more dominant; when Alabama's were lower during that same period, they fired the coach and brought in Saban and the rest is history. Auburn did sneak in there, but it seems to hold pretty true. Could be wrong, but that is what it looks like.
What does the future hold? Will the SEC continue to dominate the next 10 years or will the B1G return to prominence? It looks like OSU should continue to be OSU and UM should return to being UM. Personally I don't care if the rest of the B1G is crap as long as it doesn't prevent UM from getting into the playoff system.
One question I have, which I constantly hear about from an SEC friend, is whether regional differences in players are taken into account. His contention is that a four * from the state of Florida may well be a superior player to a four * from the Midwest, due to year round emphasis on football and weather which allows for same to occur.
This is not the first time this subject has been broached on Mgoblog, and I am not sure to what extent such a contention would be valid, but all things being equal, it seems plausible that the theory of regional variances might have some degree of validity. When looking at averages, a tenth of a point here or there, when summed, starts to become statistically significant, particularly when oversigning enters the equation.
I'd be interested in hearing some thoughts from other members on this topic.
players in a class have remained realtively constant and the percentage of 3* has increased at the expense of 2* players. The claim is that if we compare the last two classes to the first two classes in your sample we'd find that an overall class standing which today would rank in the bottom quarter of the 3* would have been ranked in the top of the 2* in the earlier classes.
Does your data show that to be the case? If so is it worth controlling for such a trend?

Comments