Michigan Museday Matches Nickels and Dimes


Background image by mgouser hillhaus
A thing I noticed this offseason while going over the depth and usage of various Michigan defenders is that Mattison used a lot more nickel than we gave him credit for. One thing Ace noted was that we're (finally) recruiting more cornerbacks. We shrugged a bit while losing two more CBs to playing time transferitis this fall, but I don't think we should be shrugging so much.
A little background (skip this if you already know personnel terminology and usage): Defensive coaches tend to match their personnel to the types of players on the field for the offense, NOT the formation. In general the number of backs and tight ends will be matched by linebackers, and the more that come out for receivers the more DBs the defense will send out. Three wide receivers generally means five defensive backs (i.e. nickel), two wide receivers equals four DBs (e.g. 4-3 or 3-4), etc.
The classic personnel shift is on 3rd and long, when the steady rock-pounders make way for the seven-yards-or-bust fellas. But it happens so often despite the situation that it's more accurate to see the game of matching personnel as another strategic aspect of the master's football game.
The offensive personnel is usually expressed in three digits meaning # of RBs, # of tight ends, and # of receivers, respectively. So 113 means 1 RB, 1 TE, and three WRs. Sometimes they'll call that same "eleven" personnel, referring to the first two digits. Examples below; click embiggerates.
Not different:


Different:


How the matching up occurs is up to the coach. You could, for example, play a run-first OLB whenever a fullback is in, and sub him for a more rangy linebacker when the the fullback runs off the field for a tight end who's a known receiving threat. This happens all the time, but it's hard to track the defenses' reactions since we can't tell one linebacker in a formation from another in UFR. We do have data from which we can determine how many receivers were out there at any given time, and it's clear from these data that the more receivers the more defensive backs.
From the UFR defensive database, Michigan in 2011 was no exception:
| Avg. Personnel | |||
|---|---|---|---|
| WRs in Game | DL | LBs | DBs |
| Four | 3.8 | 2.4 | 4.7 |
| Three | 3.8 | 2.5 | 4.7 |
| Two | 4.0 | 3.0 | 4.0 |
| One | 4.1 | 3.3 | 3.6 |
| None | 4.7 | 3.3 | 3.0 |
| Average | 3.9 | 2.7 | 4.4 |
The last row is important because it shows Michigan left its base 4-3 Under set for an extra defensive back far more often than otherwise, usually at the expense of a linebacker. We didn't go to a nickel every time three receivers stepped on the field, in fact there were 22 plays charted where Mattison put his 4-3 personnel against four-wide (mostly against Northwestern and Purdue). But the charts not only say that Michigan was forced out of its base 4-3 set often; it says we played more Nickel downs than 4-3.
| Receivers in Formation | ||||||
|---|---|---|---|---|---|---|
| Def. Form | 4 | 3 | 2 | 1 | 0 | Total |
| Nickel | 121 | 155 | 14 | 1 | x | 291 |
| 4-3 | 22 | 34 | 195 | 29 | x | 280 |
| Okie | 20 | 32 | 2 | x | x | 54 |
| 4-4 | 1 | x | 6 | 11 | 1 | 19 |
| 4-6 | x | x | 10 | 5 | x | 15 |
| 3-3-5 | 5 | 7 | 1 | x | x | 13 |
| 5-3 | x | x | 1 | 2 | 1 | 4 |
| Goal line | x | 1 | x | 2 | 1 | 4 |
| 3-4 | 1 | 1 | x | 1 | x | 3 |
| 6-2 | x | x | 1 | 1 | x | 2 |
| Dime-30 | 1 | x | x | x | x | 1 |
| Dime-40 | x | 1 | x | x | x | 1 |
| Total | 171 | 231 | 230 | 52 | 3 | 687 |
If I remove 4th quarters and all plays that occurred when Michigan was up by more than one score, the 4-3 just barely edges the Nickel, 147 to 140. This isn't opponents trying to play catch-up. It's two things: the personnel that Mattison inherited, and the spread offense forcing Michigan to adapt to it.
--------------------------------------------
Why all the nickel and diming? The first part is a story about outside linebacker. Early in the 2011 season Michigan played Brandon Herron and Brandin Hawthorne at WILL, while at SAM we lost Cam Gordon to injury and his backup was a redshirt freshman. That freshman, Jake Ryan, was earning his way toward more playing time, but in the meantime we still had Carvin Johnson taking snaps at free safety while Thomas Gordon was in at the nickel role. Watch what happened at about mid-season:

That is Gordon moving to free safety and splitting time with Woolfolk, while the freshmen linebackers had their usages increase. Greater faith in Jake and Des explains some of the variance, however the real story is matching personnel:
| Opponent | Receivers | DBs | Difference | 4-3 | Nickel | Okie | Other |
|---|---|---|---|---|---|---|---|
| Western Michigan | 3.02 | 4.68 | 1.67 | 15.79% | 59.65% | 15.79% | 8.77% |
| Notre Dame | 3.05 | 4.49 | 1.44 | 25.00% | 51.25% | 12.50% | 11.25% |
| Eastern Michigan | 2.20 | 3.98 | 1.78 | 57.78% | 17.78% | 4.44% | 20.00% |
| San Diego State | 2.51 | 4.38 | 1.88 | 43.21% | 44.44% | 6.17% | 6.17% |
| Minnesota | 2.72 | 4.36 | 1.64 | 50.00% | 41.67% | 2.78% | 5.56% |
| Northwestern | 3.75 | 4.82 | 1.07 | 14.75% | 80.33% | 0.00% | 4.92% |
| Michigan State | 2.36 | 4.25 | 1.90 | 55.93% | 32.20% | 1.69% | 10.17% |
| Purdue | 3.07 | 4.30 | 1.24 | 60.87% | 32.61% | 0.00% | 6.52% |
| Iowa | 2.02 | 4.04 | 2.02 | 64.81% | 16.67% | 5.56% | 12.96% |
| Illinois | 2.83 | 4.57 | 1.74 | 25.71% | 52.86% | 14.29% | 7.14% |
| Nebraska | 2.83 | 4.28 | 1.45 | 37.50% | 35.00% | 15.00% | 12.50% |
| Ohio State | 2.48 | 4.19 | 1.71 | 58.62% | 24.14% | 12.07% | 5.17% |
| Total | 2.75 | 4.38 | 1.63 | 40.76% | 42.36% | 7.86% | 9.02% |
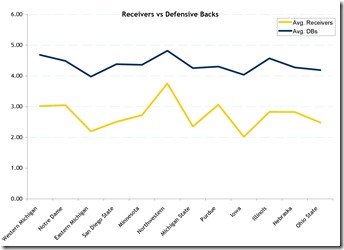
I pointed out the two extremes on the schedule with boldation: Northwestern used about twice as many receivers in their formations as Iowa did, but there was a limit to how many defensive backs Michigan would counter with. The nickel served as well for 4 WR as for 3, yet accounted for 4 in 5 plays. However when the opposition went to 2 WR (Iowa), Mattison could spend a majority of the game in the 4-3.
--------------------------------------------
When Michigan's on offense. Nothing is out of the ordinary yet, but when we turn the tables and show how defenses have reacted to Michigan's personnel it gets interesting:
| Season | Avg. Receivers in Formation | Avg. DBs in Formation | Difference |
|---|---|---|---|
| 2008 | 3.13 | 4.36 | 1.2 |
| 2009 | 2.84 | 4.46 | 1.6 |
| 2010 | 3.07 | 3.93 | 0.9 |
| 2011 | 2.62 | 4.2 | 1.6 |
| Total | 2.91 | 4.22 | 1.3 |
This is not including anything when Michigan was more than a score down, but the season averages counting everything say about the same thing. I went through the plays and even a few youtubes and yes, in 2010 they played one-high against us despite spreading the field to pass as much as Purdue. Michigan went bigger in 2011, and got more defensive backs, which is counterintuitive except for one factor: opponents in 2010 really really really feared the running game, and tempted Michigan to pass.

Okie dokie. | Greg Shamus via ESPN
One more table to break this down by Michigan's opponents last year, 4th quarters and two-plus-score leads excised:
| Opponent | WRs in formation | DBs in formation | Difference |
|---|---|---|---|
| Western Michigan | 2.41 | 3.97 | 1.6 |
| Notre Dame | 3.10 | 4.60 | 1.5 |
| Eastern Michigan | 2.71 | 4.11 | 1.4 |
| San Diego State | 2.44 | 4.89 | 2.4 |
| Minnesota | 2.31 | 3.77 | 1.5 |
| Northwestern | 2.55 | 3.89 | 1.3 |
| Michigan State | 2.54 | 4.00 | 1.5 |
| Purdue | 2.53 | 4.13 | 1.6 |
| Iowa | 2.67 | 4.08 | 1.4 |
| Illinois | 2.78 | 4.04 | 1.3 |
| Nebraska | 2.67 | 4.43 | 1.8 |
| Ohio State | 2.79 | 4.21 | 1.4 |
| Total | 2.62 | 4.12 | 1.5 |
Nothing really jumps out except perhaps more spread in close games, and SD State's apparent paucity of linebackers (weird—didn't they just have that guy who recruits lots of linebackers there?) Actually that's Charlie Strong's 3-3-5, and the GERG numbers from 2010 are similar due to the same effect.
--------------------------------------------
What it means for this year. Alabama and Air Force aren't going to be spread it out—their challenges are elsewhere. However the Big Ten schedule is spread-heavy, with Ohio State joining the ranks of the many-receivered. Due to recent attrition, Michigan goes into 2012 with just six scholarship cornerbacks for three positions that will be filled half the time. It's a good thing the coaching staff has four guys coming in at corner to replace the one expected departure. These days, in order to keep up with the Joneses, that nickelback position has to be considered as much of a starter as, well, a third receiver.
August 15th, 2012 at 9:54 AM ^
This whole post is a wonderful example of how some people don't know what types of graphs (or statisitcs in general) to use to display useful information.
August 15th, 2012 at 10:50 AM ^
I've never had any formal training on that. If you have suggestions on how I can do a better job with graphs, etc. I'm all ears. I taught myself this shit and am going entirely on instinct and the hope the information gets across. I welcome your suggestions.
August 15th, 2012 at 10:58 AM ^
August 15th, 2012 at 12:10 PM ^
I thought this was a super post, but if you want suggestions on things you could do differently (just spit balling here).
Total Season Count of Plays (ex. 16 plays of "other" to focus the discussion)
| # of Receivers in Opponent's Formation | |||||
| UM Defense | 4 | 3 | 2 | 1 | Total |
| Nickel | 121 | 155 | 14 | 1 | 291 |
| 4-3 | 22 | 34 | 195 | 29 | 280 |
| Okie | 20 | 32 | 2 | 0 | 54 |
| 4-4 | 1 | 0 | 6 | 11 | 18 |
| 4-6 | 0 | 0 | 10 | 5 | 15 |
| 3-3-5 | 5 | 7 | 1 | 0 | 13 |
| Total | 169 | 228 | 228 | 46 | 671 |
| % of Total | 25% | 34% | 34% | 7% | 100% |
% By Formation (Reads: Given the opponent is in a 4 receiver set, we play nickel 72% of the time. Interesting: note there really is not a significant difference between 3 and 4 receiver sets.)
| # of Receivers in Opponent's Formation | |||||
| UM Defense | 4 | 3 | 2 | 1 | Total |
| Nickel | 72% | 68% | 6% | 2% | 43% |
| 4-3 | 13% | 15% | 86% | 63% | 42% |
| Okie | 12% | 14% | 1% | 0% | 8% |
| 4-4 | 1% | 0% | 3% | 24% | 3% |
| 4-6 | 0% | 0% | 4% | 11% | 2% |
| 3-3-5 | 3% | 3% | 0% | 0% | 2% |
| Total | 100% | 100% | 100% | 100% | 100% |
For Game by Game analysis I would do an XY Scatter of (X = % of Plays Opponent was in a 3 or 4 receiver set, Y = % of those plays Michigan was in Nickel) in order to see if we played anybody significantly differently than our 70% average, or if its completely explained by how many 3 and 4 receiver set plays the opponent ran.
August 15th, 2012 at 1:44 PM ^
Well, for starters:
There is no reason why this is a line graph. It implies a relevant relationship over time; that somehow Purdue being played right after MSU is relevant, and the # of Recievers/DBs between those two games somehow has relational relevance more significant than Ohio State vs Western Michigan. Each offense Michigan played had no relationship to any other offense. A scatter plot of Recievers vs DBs with each point representing a game would actually present some sort of coherant data. This? Not so much. Also, making conclusions off of the 'average personel' numbers is dubious, at best, since 1.) the data you're averaging is marginally significant to begin with, and (probably more importantly) 2.) taking an average throws the distribution of plays out. e.g. A team that only uses a 4-3 is going to look the same as a team that 50% of the time uses a nickel and 50% of the time runs a 4-4.
Another example is of poor use of your options graphically, is this: 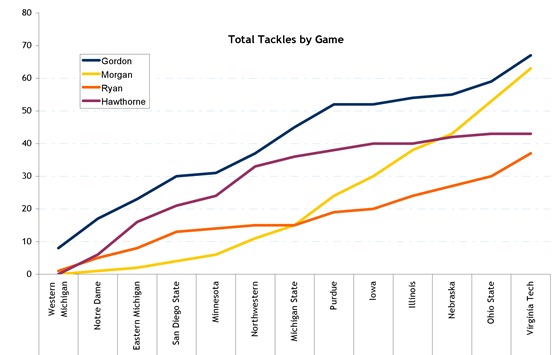
While this graph has the relevant data hidden in it, it's a poor way of showing it. You're trying to make the point that halfway through the season, Gordon's production increased. You're trying to show the rate of change of this graph (number of tackles per game), so show it. While in this actual graph, it is appropriate to show as a line graph, the data you want shouldn't be. Ideally, this would be a histogram of tackles per game. More significantly, you could create a graph showing percentages of tackles per game. This would have the nice effect of controlling for opponents offensive style/tempo, and show who was really contributing the most, tackles-wise.
What you're really missing here, is how effective each defensive set was verses each offensive set. Was the defense lowering YPP when they added a nickelback against 3 WRs? How well did the offense do with 3-Wide against the 4-3 vs the nickel? This is data you have, and it would actually be interesting to see. This post, however, is not.
August 15th, 2012 at 2:31 PM ^
these are actually pretty good suggestions, and i'll second that line graphs should really only be used when expressing a change over time. another good rule of thumb to keep in mind is to never use pie charts or 3d anything. both almost always sacrifice clarity for flashiness
August 15th, 2012 at 2:37 PM ^
If the games are in chronological order don't they implicitly represent time?
August 15th, 2012 at 2:53 PM ^
Only if there some significance to the order. The fact that Iowa is before or after Purdue has no bearing on how many recievers each team put up against Michigan, or how many DBs Michigan used to counter it.
August 15th, 2012 at 3:05 PM ^
There are a few instances when pie charts are usable, but they only show one dimension of data. If you want to show percentages and how they change overtime, for example, an area graph can concisely present the information, whereas you would need to produced multiple pie charts.
August 15th, 2012 at 3:41 PM ^
Thank you very much for your criticism! If I shared the data with you, would you be interested in creating a few better versions?
August 15th, 2012 at 11:22 AM ^
Can't wait for your post, Snowboarder.
August 15th, 2012 at 11:24 AM ^
August 15th, 2012 at 10:31 AM ^
Seth, I don't know where you get your information but it clearly isn't accurate. Didn't you know THE SPREAD CAN'T WORK IN THE B1G!!! How could we possibly be spread heavy?
I shouldn't hae to do this but just in case.../s
August 15th, 2012 at 10:42 AM ^
Interesting perspective into the mind of the enemy on the minutiae of something as seemingly insignificant as terminology for defensive positions:
August 15th, 2012 at 10:48 AM ^
This post and those like it are why I love this site. Thanks Seth, I am now measurably smarter!
August 15th, 2012 at 11:33 AM ^
...would you graph those measurements?
Snowboarder...any suggestions?
/s
August 15th, 2012 at 11:31 AM ^
That post was great. Thanks for taking the time to research all that.
August 15th, 2012 at 11:31 AM ^
Here comes the stupid question: if the ball is placed on the right hash, does the WDE line up on that side along with the Will? Does the same happen if the ball is on the left side? Thanks for your help gang
August 15th, 2012 at 11:53 AM ^
Some coaches will shift techniques rather than flipping players if there's a matchup they favor.
The biggest effect that hash position has on a defense is for corners, field and boundary. But, even they might follow a receiver or formation.
August 15th, 2012 at 12:05 PM ^
There isn't a rule. In general the offense will align its "strong" side (ie the side with more players on it) to the wide side of the field, since that gives them more room to run to the sideline. In the 4-3 Under the SAM is kind of a hybrid DE/OLB -- he's basically the WDE for the other side, and has to be a bit more athletic and coverage oriented because all of the space that's out there.
I'm pretty sure that "Under" shift basically means that the DL is shifted away from the strong side of the formation, the concept being the linebackers are then shifted "Over" to compensate. The WDE's job then is to hold the weakside if the play goes that way, and otherwise pass rush.
Fronts can shift as quickly as a back crosses the formation, so it's not like the "Weakside" defensive end will always be on the weak side. Spread teams value the extra horizontal space to the wide side so much they'll rarely flip the strength of their offense pre-snap to capitalize on whatever difference there is between the WDE and SDE in edge protection. They make you pull the SAM for a nickel unless your SAM can cover the slot receiver wherever he goes, and then they run at the nickelback. For a converse, think of the DeBord zone-left offense, when Michigan would often line up on the left hash with the fullback and tight end to the wide side of the field, then shuffle the FB to the left and run left, the idea being the WDE is constantly having to hold up to double-teams instead of the 5-tech.
August 15th, 2012 at 11:52 AM ^
it's, it's mesmerizing.
August 15th, 2012 at 1:21 PM ^
I be hyp-mo-tized!

August 15th, 2012 at 11:52 AM ^
Your description for that chart is;
I pointed out the two extremes on the schedule with boldation: Northwestern used about twice as many receivers in their formations as Iowa did, and Michigan got to spend four times as many plays in the 4-3 because of it.
But you highlighted Minnesota and Iowa. Not Northwestern and Iowa. The logic of the second sentence seems flipped. Iowa had less receivers than Northwestern, yet the sentence says Michigan was in the 4-3 because of "it" and the it for me refers to the Northwestern situation of more receivers. What I can see from the chart is that for Iowa Michigan was in the 4-3 more than 60% of the time, and for Northwestern was in the 4-3 just a hair under 15% which is ballpark for "being in the 4-3 for Iowa, 4x more than being in the 4-3 for Northwestern.
If I'm correct in reading the chart, then it does support you basic premise that Michigan responds to 3+ receivers (which is also an indication of "spread" formations) with a Nickel package.
I would like to point out that responding to 3+ WR's with a Nickel is not a new development strategically. Go back and watch the Rose Bowl against WSU and you'll see a Michigan defense that almost never put their Mike LB on the field, and sometimes only had one LB with a four man front (maybe this is Dime?) That was in response to WSU having an injury to their main RB and playing almost the entire game in 4 WR sets. Note this has nothing to do with a Run Option QB, which is the main Strategy of the Rich Rodriguez offense. It's more in response to the threat to pass. I bring this up in counter to the next chart by season where you highlight 2010 and characterize the defensive response as "fearing the run". Maybe I'm reading too much into this, but of course opposing teams feared the run, because they were facing a Run Option Offense that rarely if ever used a TE. So of course the differential as measured by WR to DBs is going to be low. But I'm hypothesizing that if you examined 2010 against the other seasons for "passing down situations" that the defensive response to the Michigan offense is more similar between 2010 and 2011 than different. And that is without throwing in other qualitative points of view like, 2010 Denard was not a QB that demanded tight coverage, nor was Rich Rodriguez a coach who used complex crossing and isolation routes for the WR. The strategy was pretty much "run Denard and streak the WR's, if the Safety sucks down Roundtree will be open"
Although that did not seem to be the case for MSU, Wisconsin and OSU. Or really Mississippi State either. Maybe all those defenses didn't really fear the passing game, rather than they did fear the running game.
August 15th, 2012 at 1:03 PM ^
That .gif is incredibly informative... once I downloaded it and took it apart piece by piece in GIMP. Up at the top of the page it flashes by too quickly - which I guess just shows I can't play quarterback. I like the format, but maybe next time slow down the frame-rate?
One question - I'm guessing this is me not knowing enough - but frame 10 is labeled "Offense: 122" when it seems like it should be 212 (I-form with HB and FB, Y on right end, 2 wide).
Anyway, cool post.
August 15th, 2012 at 1:50 PM ^
that gif doesn't have a 3-3-5!!
August 15th, 2012 at 2:13 PM ^
If I had a dollar for every time my photo of the field was used without permission, I'd be a wealthy man. I've never seen someone put another brand on it though (i.e., the mgologo). That seems just a tad bit unprofessional, a little below the level of what I expect to see here. http://www.hillhaus.com/index.php/2006/12/29/michigan_stadium_the_big_house_1
Several schools have used that photo in their media kits (mostly before the stadium expansion). All of them were professional enough to ask. Combine all of those media kits together and the readership is probably less than the daily visitors to this blog. Just emphasizing the fact that you need to follow higher standards. This isn't Ohio, fergodsakes.
August 15th, 2012 at 2:20 PM ^
...And we can tell it's yours because it's off-center.
August 15th, 2012 at 2:30 PM ^
The dots on the field are a better indication.
August 15th, 2012 at 3:17 PM ^
Never knew who it belonged to. I'll credit now.!
August 15th, 2012 at 3:26 PM ^
Many thanks!
August 15th, 2012 at 4:19 PM ^
When did you get that shot with no one and nothing in the Stadium?
August 15th, 2012 at 8:31 PM ^
Seth, you questioned why SDSU averaged 4.89 DBs despite Michigan averaging 2.44 WRs against them; this is because SDSU runs a 3-3-5. You might recall that Hoke was replaced as head coach by Rocky Long, who runs the 3-3-5 almost exclusively.
Edit: woops, it seems you already pointed that out. My bad.
August 16th, 2012 at 7:36 AM ^
Comments