Projecting Michigan's Defensive Success in 2012
What should we expect in Year 2 from a Greg Mattison led defense?
I'm going to attempt to answer that question by looking at trends from his previous stints elsewhere.
Greg Mattison has been a defensive coordinator for 2 years or longer at 4 different schools: Western Michigan University (1985-86), Michigan (1995-96), Notre Dame (1997-2001), and Florida (2005-07). I’ll examine those changes that Mattison’s defense made from Year 1 to Year 2.
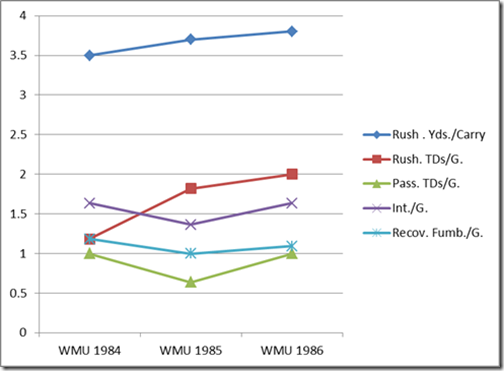
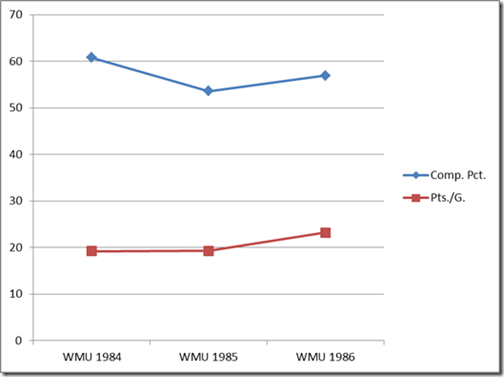
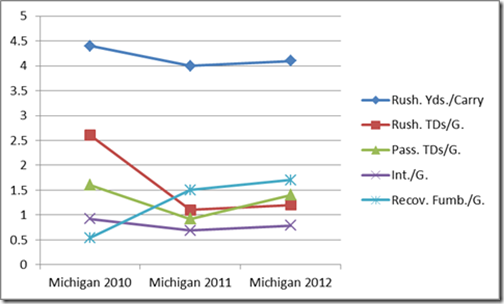
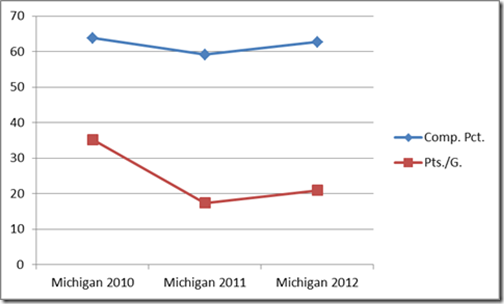
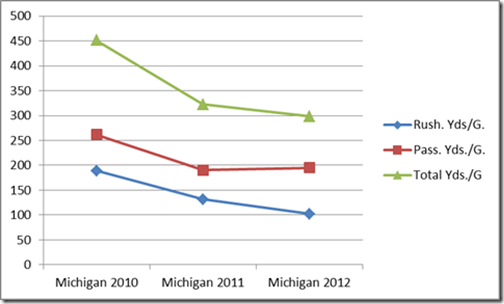
I’m going to take the time to quickly explain what you will see below. The rest of this diary is split up into 5 sections: Western Michigan, Michigan, Notre Dame, Florida, and the Summary. The first 4 sections each have 2 sub-sections: a sub-section examining Mattison’s time at the respective coaching stop and a sub-section applying the trend from the respective coaching stop to Michigan in 2012. Each sub-section will contain 3 charts and 3 tables. Each chart depicts the trend over 3 years. The tables contain the respective raw data. The 1st year shown will be the year before Mattison arrived, the 2nd year shown will be Mattison’s 1st year at the program, and the 3rd year shown will be Mattison’s 2nd year at the program. Years 2 and 3 will be bolded to signify those years as the years in which Mattison was the coach. If it sounds confusing, it all makes sense once you start reading.
Now for a word on the methodology. The math used was really quite simple, I just used proportions to estimate the stats for Michigan in 2012. I’ll illustrate how I calculated the predictions using the numbers from Greg Mattison’s time at Michigan from 1995-1996. The calculation is solving for the expected points allowed per game in 2012.
Solve for X and the number you get is 15.6 points/game. That’s the number we should expect from the defense in 2012 based on Greg Mattison’s performance at Michigan from 1995-1996. I followed the same procedure for each category for each team. It can produce some unrealistic numbers but it’s a relatively simplistic method that provides a general idea of what to expect. I’ll point out some of the unrealistic numbers as they pop up.
I’ll keep the commentary scarce until the summary, as there really isn't much to comment on.
Western Michigan
|
Rush. Yds/G. |
Pass. Yds./G. |
Total Yds./G |
|
|
WMU 1984 |
146.8 |
210.5 |
357.4 |
|
WMU 1985 |
173.8 |
138.2 |
312 |
|
WMU 1986 |
163.6 |
213 |
376.6 |
|
2nd Year Difference |
-10.2 |
+74.8 |
+64.6 |
|
Rush. Yds./Carry |
Rush. TDs/G. |
Pass. TDs/G. |
Int./G. |
Recov. Fumb./G. |
|
|
WMU 1984 |
3.5 |
1.2 |
1 |
1.6 |
1.2 |
|
WMU 1985 |
3.7 |
1.8 |
0.64 |
1.4 |
1 |
|
WMU 1986 |
3.8 |
2 |
1 |
1.6 |
1.1 |
|
2nd Year Difference |
+0.1 |
+0.2 |
+0.36 |
+0.2 |
+0.1 |
|
Comp. Pct. |
Pts./G. |
|
|
WMU 1984 |
60.8 |
19.2 |
|
WMU 1985 |
53.6 |
19.3 |
|
WMU 1986 |
56.9 |
23.2 |
|
2nd Year Difference |
+3.3 |
+3.9 |
Applying it to Michigan
|
Rush. Yds/G. |
Pass. Yds./G. |
Total Yds./G |
|
|
Michigan 2010 |
188.9 |
261.8 |
450.8 |
|
Michigan 2011 |
131.7 |
190.5 |
322.2 |
|
Michigan 2012 |
124 |
293.6 |
388.9 |
|
2nd Year Difference |
-7.7 |
+103.1 |
+66.7 |
|
Rush. Yds./Carry |
Rush. TDs/G. |
Pass. TDs/G. |
Int./G. |
Recov. Fumb./G. |
|
|
Michigan 2010 |
4.4 |
2.6 |
1.6 |
0.92 |
0.54 |
|
Michigan 2011 |
4 |
1.1 |
0.92 |
0.69 |
1.5 |
|
Michigan 2012 |
4.1 |
1.2 |
1.4 |
0.79 |
1.7 |
|
2nd Year Difference |
+0.1 |
+0.1 |
+0.48 |
+0.1 |
+0.2 |
|
Comp. Pct. |
Pts./G. |
|
|
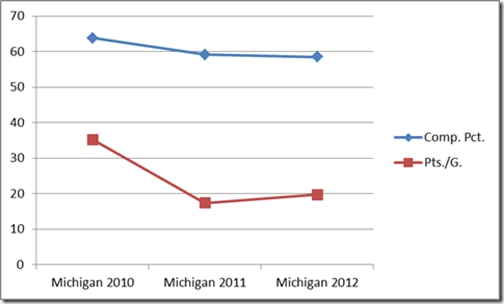
Michigan 2010 |
63.8 |
35.2 |
|
Michigan 2011 |
59.1 |
17.4 |
|
Michigan 2012 |
62.7 |
20.9 |
|
2nd Year Difference |
3.6 |
3.5 |
Notes of Importance
-A 103.1 Yds/G (!) increase in Passing yards allowed from 190.5 to 293.6 Yds/G is unrealistic; This would be more Passing yards allowed than in 2010, by over 30 yards.
Michigan
**Note: The only statistic available for Mattison’s first stint at Michigan is Pts./G**
|
Pts./G. |
|
|
Michigan 1994 |
22.3 |
|
Michigan 1995 |
17.2 |
|
Michigan 1996 |
15.3 |
|
2nd Year Difference |
-1.9 |
Applying it to Michigan
|
Pts./G. |
|
|
Michigan 2010 |
35.2 |
|
Michigan 2011 |
17.4 |
|
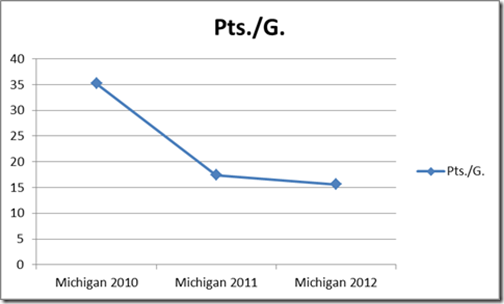
Michigan 2012 |
15.6 |
|
2nd Year Difference |
-1.8 |
Notre Dame
|
Rush. Yds/G. |
Pass. Yds./G. |
Total Yds./G |
|
|
Notre Dame 1996 |
119.5 |
150.5 |
270 |
|
Notre Dame 1997 |
184.8 |
180.3 |
365.1 |
|
Notre Dame 1998 |
146.2 |
208.4 |
365 |
|
2nd Year Difference |
-38.6 |
+28.1 |
-0.1 |
|
Rush. Yds./Carry |
Rush. TDs/G. |
Pass. TDs/G. |
Int./G. |
Recov. Fumb./G. |
|
|
Notre Dame 1996 |
3.1 |
1.3 |
0.82 |
1.2 |
0.55 |
|
Notre Dame 1997 |
4.5 |
1.7 |
0.38 |
1.1 |
0.31 |
|
Notre Dame 1998 |
3.5 |
0.83 |
1.3 |
1 |
0.67 |
|
2nd Year Difference |
-1 |
-0.87 |
+0.92 |
-0.1 |
+0.36 |
|
Comp. Pct. |
Pts./G. |
|
|
Notre Dame 1996 |
44.9 |
16.5 |
|
Notre Dame 1997 |
57.4 |
18.3 |
|
Notre Dame 1998 |
56.8 |
20.7 |
|
2nd Year Difference |
-0.6 |
+2.4 |
Notes of Importance
-Notre Dame significantly improved in almost every category except for Pass defense and Scoring defense.
Applying it to Michigan
|
Rush. Yds/G. |
Pass. Yds./G. |
Total Yds./G |
|
|
Michigan 2010 |
188.9 |
261.8 |
450.8 |
|
Michigan 2011 |
131.7 |
190.5 |
322.2 |
|
Michigan 2012 |
104.2 |
220.2 |
322.1 |
|
2nd Year Difference |
-27.5 |
+29.7 |
-0.1 |
|
Rush. Yds./Carry |
Rush. TDs/G. |
Pass. TDs/G. |
Int./G. |
Recov. Fumb./G. |
|
|
Michigan 2010 |
4.4 |
2.6 |
1.6 |
0.92 |
0.54 |
|
Michigan 2011 |
4 |
1.1 |
0.92 |
0.69 |
1.5 |
|
Michigan 2012 |
3.1 |
0.53 |
3 |
0.64 |
3.3 |
|
2nd Year Difference |
-0.9 |
-0.57 |
+2.08 |
-0.05 |
+1.8 |
|
Comp. Pct. |
Pts./G. |
|
|
Michigan 2010 |
63.8 |
35.2 |
|
Michigan 2011 |
59.1 |
17.4 |
|
Michigan 2012 |
58.5 |
19.7 |
|
2nd Year Difference |
-0.6 |
+2.3 |
Notes of Importance
-Recovering 3+ fumbles a game is unrealistic. I doubt that it has ever happened in the modern era.
Florida
|
Rush. Yds/G. |
Pass. Yds./G. |
Total Yds./G |
|
|
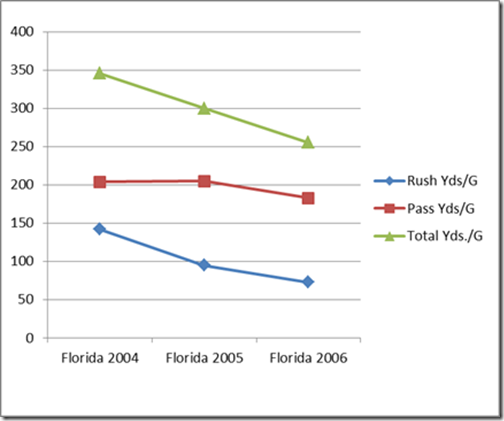
Florida 2004 |
141.9 |
203.7 |
345.6 |
|
Florida 2005 |
94.9 |
204.9 |
299.8 |
|
Florida 2006 |
72.5 |
182.9 |
255.4 |
|
2nd Year Difference |
-22.4 |
-22 |
-44.4 |
|
Rush. Yds./Carry |
Rush. TDs/G. |
Pass. TDs/G. |
Int./G. |
Recov. Fumb./G. |
|
|
Florida 2004 |
3.7 |
0.9 |
1.3 |
1.4 |
0.6 |
|
Florida 2005 |
3.1 |
1.2 |
1.3 |
1.3 |
1.3 |
|
Florida 2006 |
2.7 |
0.6 |
0.7 |
1.5 |
0.6 |
|
2nd Year Difference |
-0.4 |
-0.6 |
-0.6 |
+0.2 |
-0.7 |
|
Comp. Pct. |
Pts./G. |
|
|
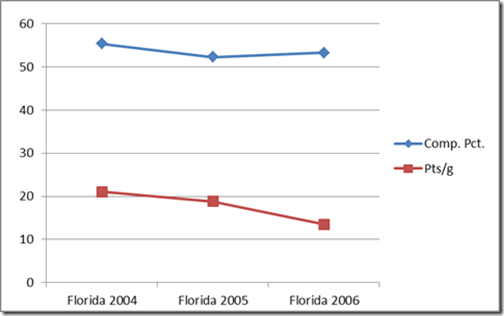
Florida 2004 |
55.4 |
21.1 |
|
Florida 2005 |
52.3 |
18.8 |
|
Florida 2006 |
53.3 |
13.5 |
|
2nd Year Difference |
+1 |
-5.3 |
Applying it to Michigan
|
Rush. Yds/G. |
Pass. Yds./G. |
Total Yds./G |
|
|
Michigan 2010 |
188.9 |
261.8 |
450.8 |
|
Michigan 2011 |
131.7 |
190.5 |
322.2 |
|
Michigan 2012 |
100.6 |
170 |
274.4 |
|
2nd Year Difference |
-31.1 |
-20.5 |
-47.8 |
|
Rush. Yds./Carry |
Rush. TDs/G. |
Pass. TDs/G. |
Int./G. |
Recov. Fumb./G. |
|
|
Michigan 2010 |
4.4 |
2.6 |
1.6 |
0.92 |
0.54 |
|
Michigan 2011 |
4 |
1.1 |
0.92 |
0.69 |
1.5 |
|
Michigan 2012 |
3.5 |
0.54 |
0.5 |
0.8 |
0.71 |
|
2nd Year Difference |
-0.5 |
-0.56 |
-0.42 |
+0.11 |
-0.79 |
|
Comp. Pct. |
Pts./G. |
|
|
Michigan 2010 |
63.8 |
35.2 |
|
Michigan 2011 |
59.1 |
17.4 |
|
Michigan 2012 |
60.2 |
12.5 |
|
2nd Year Difference |
+1.1 |
-4.9 |
Notes of Importance
-If we see the same improvement that Mattison saw in his 2nd year at Florida, this defense could be the best in the nation
Summary
|
Rush. Yds./Carry |
Rush. Yds/G. |
Rush. TDs/G. |
Comp. Pct. |
Pass. Yds./G. |
Pass. TDs/G. |
Total Yds./G |
Pts./G. |
Int./G. |
Recov. Fumb./G. |
|
|
WMU |
4.1 |
124 |
1.2 |
62.7 |
293.6 |
1.5 |
388.9 |
20.9 |
0.83 |
1.7 |
|
ND |
3.1 |
104.2 |
0.53 |
58.5 |
220.2 |
3 |
322.1 |
19.7 |
0.64 |
3.3 |
|
Florida |
3.5 |
100.6 |
0.54 |
60.2 |
170 |
0.5 |
274.4 |
12.5 |
0.8 |
0.71 |
|
Michigan |
15.6 |
|||||||||
|
Average w/WMU |
3.6 |
109.6 |
0.76 |
60.5 |
227.9 |
1.7 |
328.5 |
17.2 |
0.76 |
1.9 |
|
Average w/o WMU |
3.3 |
102.4 |
0.54 |
59.4 |
195.1 |
1.8 |
298.3 |
15.9 |
0.72 |
2 |
|
Median |
3.5 |
104.2 |
0.54 |
60.2 |
220.2 |
1.5 |
322.1 |
19.7 |
0.8 |
1.7 |
I wasn’t sure whether to use the median or the average of the projected data without WMU for the final projections but I decided to use the average obtained without using the WMU data for the final projections for several reasons:
1. WMU was Mattison’s first coaching stop. Looking at the data as a whole, the WMU data was significantly different than other coaching stops and skews the data. The median would normally correct for this but so few data points exist that the median isn’t very helpful in this regard.
2. WMU as a MAC school has a lower level of talent than ND, Florida and Michigan, which are all upper-tier BCS schools. I’m not sure if it’s the primary reason behind the major difference but it might have an effect.
3. I had already created all the charts and tables for the average without WMU and I didn’t think it was necessary to create the charts and tables for the median. If anyone is outraged by this say so in the comments and I’ll think about adding it in if the anger is great enough.
On to the final projected stats for the 2012 Michigan defense:
|
Rush. Yds/G. |
Pass. Yds./G. |
Total Yds./G |
|
|
Michigan 2010 |
188.9 |
261.8 |
450.8 |
|
Michigan 2011 |
131.7 |
190.5 |
322.2 |
|
Michigan 2012 |
102.4 |
195.1 |
298.3 |
|
2nd Year Difference |
-29.3 |
+4.6 |
-23.9 |
|
Rush. Yds./Carry |
Rush. TDs/G. |
Pass. TDs/G. |
Int./G. |
Recov. Fumb./G. |
|
|
Michigan 2010 |
4.4 |
2.6 |
1.6 |
0.92 |
0.54 |
|
Michigan 2011 |
4 |
1.1 |
0.92 |
0.69 |
1.5 |
|
Michigan 2012 |
3.3 |
0.54 |
1.8 |
0.72 |
2 |
|
2nd Year Difference |
-0.7 |
-0.56 |
+0.88 |
+0.03 |
+0.5 |
|
Comp. Pct. |
Pts./G. |
|
|
Michigan 2010 |
63.8 |
35.2 |
|
Michigan 2011 |
59.1 |
17.4 |
|
Michigan 2012 |
59.4 |
15.9 |
|
2nd Year Difference |
+0.3 |
-1.5 |
One final note: hundreds, if not thousands, of confounding variables exist and I didn’t account for any of them. Listing them here would be pointless. Just take all these numbers with a grain of salt and know they’re not going to be entirely accurate. They’re just meant to give an idea of what to expect.
Anyways, hope you guys enjoyed this. Please leave some feedback as I’ll be doing something similar for the offense and I’d like to know what I should add, leave out or leave the same. I expect to have it out in around 2 weeks. This was also my first time publishing with Windows Live Writer so I have no idea if the format will turn out fine. Sorry in advance if it isn’t.
bottom line might mean that talent + coaching = win?
Thats what i got.
It seems like with a second year in Mattison's system the kids playing are able to do more of what he wants. I know he talks about being an attacking defense, so maybe they can do more effective blitzing or coverage the way the he wants them to.
Thanks for the effort, I liked your work.
Great work here. I expect a major confounding factor to be the relative difficulty of our schedule. 2011's schedule was very favorable (8 home games, didn't play Wisconsin, got OSU at home when they were terrible). The 2012 schedule is much more difficult (6 road games including vs. Alabama in Dallas, Notre Dame, Nebraska, and Ohio State). It could be that the defense is as good as last year but is worse statistically because of the big jump in schedule difficulty. It would be interesting to see whether this was a factor between Mattison's first and second years at WMU.
It will be interesting to see if Mattison's record of improving against the run in the second year can be maintained.
Also, I understand you're just looking at numbers and extrapolating, but there's no way that we recover 2 fumbles a game this year. According to cfbstats.com, in the past 5 years the most fumbles in a season a team has recoved is Buffalo, with 26 in 14 games in 2008. And that's a definite anomaly, as BYU was second in the past 5 years w/ 21 in 13 games, also in 2008. I do like seeing the numbers and charts, but that's a nearly impossible projection.
Holy shit, if we average 2 recovered fumbles per game I'll eat my proverbial hat.
The really interesting questions owuld be to check and see both the schedule rankings at the end of the year for each of the Mattison coached teams (maybe use Sagarins final rating of the schedule) and the number of seniors departing at the end of each of those years.
That would cover both the relative strength of the opposition and the relative experience of the team.
Great analysis!
The graphs in the original post are a good start, but we would need to know the level of returning experience (based on tackles, etc) at the different position groups as well as the change in schedule strength.
Lets just go with Mattison's 2nd year at Florida and have ourselves the best defense in the country this year.
Clearly all the charts and lines show that is what will happen.
I love the effort. Best D in the country, here we come!
I'm not sure how--without taking personnel (the most important variable) into account--you can hope to adequately predict more than general success for Mattison & Co. Still, I like the conclusions your stats point to.
I would consider changing the title, though, to something like Projecting 2012 M Defense Success; I was convinced you were going to tell me who was starting on D this year.
EDIT: should have said current personnel, I suppose, since your data does take previous players into account to a certain extent
For the one you do on offense, if the whole # of returning starters is difficult to determine, I would definitely at least look at the QB position to see if in the second year the QB is the starter from the previous year or not, since Borges talks quite a bit about QBs coming into their own in the 2nd year of his system, and, obviously, Robinson will be in his second year as a starter under Borges.
I understand that if in Mattison's second year, the rushing defense is better, that teams will start passing the ball more due to 3rd and long and whatnot. But even if teams are getting more passing yards per game, shouldn't the completion percentage DROP if the defense if doing it's job well?
Just trying to understand if our secondary is something to start worrying about again, or if I am looking too deeply into the numbers posted.
Florida's 2006 defense was really good.
Seriously though, it's interesting to look at the year 2 data, even though there are many other variables to consider and the sample size is pretty small. I'd suggest adding a weight in for average starter star ranking, but even if it wouldn't take forever, the data probably isn't really available or isn't comprehensive for his first few stops.
As for a prediction...there's probably very little chance Michigan enjoys the same level of success this year on defense as it did last season, unless they are recovering 2+ fumbles per game. The out of conference offenses are going to be better and the Big 10 schedule looks marginally tougher. Also, the ability to get pressure with just the defensive lineman last year is going to be sorely missed. Martin and Van Bergen had excellent Senior seasons and killed people up front. Absent a breakout year from Roh, Black/Clark, and Campbell, I think the pass rush will suffer, forcing Mattison to blitz more, which will leave more holes in the secondary.
A 22ish points per game number will probably be pretty solid.
New here to the blog, I've been reading daily for quite some time though, and I always enjoy looking at the cold hard facts and data to interpret what may follow for the 2012 season. Side note, this blog is like crack and it's one of the highlights of my day (sad).
Maybe this was posted somewhere else or it may be too extensive to apply, but one variable I find applicable to next year is ppg home vs away. 22.0 away and 14.5 at home.
There were 5 away games(4 in reg. season with 2 wins 2 losses) and 8 home games last year and this year we have 6 away games in the regular season. The PPG on the road seems to be what I would like to see projected whether it stays constant or not. I don't know if the data is all out there for previous places Mattison has been the DC.
But long story short given the two extra games on the road this year, if they can mantain or reduce ppg on the road, I would consider that a success for team 133. (I think Zone Left kind of touched base to this)
This all may seem obvious and this might not be the right way of explaining it, but it's what came to my mind first thing after reading through the information. Great work and I'm excited to see the offensive side!
As much as I appreciate the work you did, Id like to add a factor that I don't believe was accounted for..... Mattison had a long stop in the NFL and had a great defense..... thus, I think the improvement the second year will be exponential, or accelerate, or however to say it....ie it wont be linear. Agreed ? I really believe this, and that I am not being idealistic, that the improvement will shatter your linear prediction.











Comments