Graphical Analysis of OSU points vs Michigan

I did a graph of Michigan points scored vs OSU points scored over the last 100+ years:
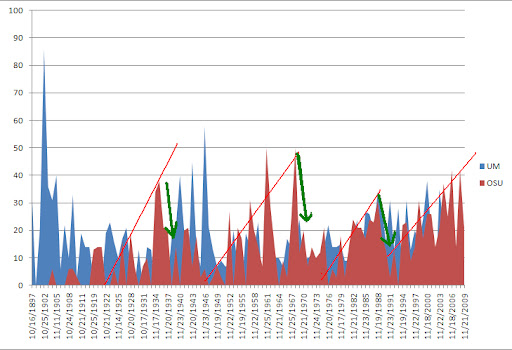
Note that the longer a coaching staff exists, the more points OSU scores - these are the red trendlines.
Also note that at or just after a coaching change, the OSU points scored decreases dramatically - these are the green arrows.
Major Points of Inflection:
1938 hire of Herbert O. Crisler (0.816 win %)
1968 hire of Glen (Bo) Schembechler (0.802 win %)
1990 hire of Gary O. Moeller (0.771 win %)
Note the Carr (0.763), Oosterbaan (0.656) and Elliott (0.548) did not make a blip in the general trend.
Also note that when the OSU score pushes past 30, in coach change occurs, the exception being the 2nd year of Elliot, where the 1st 50 points put on Elliot did not cause a change, but the 2nd 50 pt clip resulted in the hiring of Bo.
Conclusions:
Coaching changes at Michigan tend to occur when OSU puts 30+ on Michigan, the last being 42 pts in 2006.
After the coaching change, points given to OSU tends to drop quickly.
Note: When RR was hired, OSU scored 42 and last year only 21 a 50% drop-off.
November 24th, 2010 at 7:46 PM ^
HOPE :)
November 24th, 2010 at 7:48 PM ^
November 24th, 2010 at 7:49 PM ^
So... your telling me were going to win?
and I love how high the Michigan line goes up in 1902.
November 24th, 2010 at 8:02 PM ^
I remember that 1902 season, Sportscenters top plays seemed to be all Michigan plays.
November 24th, 2010 at 8:14 PM ^
Yeah 86-0 drubbing. OSU shouldn't have even taken the train to Ann Arbor.
Don't forget, though, home games are worth an extra 3 points so the game would have been much closer in Columbus.
November 24th, 2010 at 8:05 PM ^
the new math: 2010 = 1902
November 25th, 2010 at 11:49 AM ^
Totally:
19+02 = 20+1+0
November 25th, 2010 at 1:41 PM ^
Good call. Break it down even further to make them more similar:
19+0+2 = 20+1+0
November 24th, 2010 at 8:05 PM ^
Appreciate the work and it's certainly interesting data. However, I don't know how much it really applies to our current situation. I was never a huge fan of using pre-BCS era data; just so much has changed in college football and continues to change. Still, really interesting though. Thanks.
November 24th, 2010 at 8:22 PM ^
meaning margin of victory possible? that might be more telling for this analysis
November 24th, 2010 at 9:10 PM ^
is just stupid and pointless. A graph isn't going to save M*chigan from the ass beating they will endure this Saturday.
November 24th, 2010 at 9:15 PM ^
Experiment Over???
November 24th, 2010 at 9:33 PM ^
I love the time you spent on this. So your telling me we are going to win. So ill give you this. The motto of the 1997 Michigan football team. "Lets get together and make the whole world believe us". This is what charles woodson would say to the team. Go Blue and enjoy Jay-z
http://www.youtube.com/watch?v=96sFW-3vGv4
After hearing that woodson liked this cd it became my favorite Jay-Z cd of all time. Reasonable doubt. Pure Classic.
November 24th, 2010 at 9:37 PM ^
But one of the main reasons I have it is because of woodson. So if you make fun of Jay your really hating on woodson. Its woodson's favorite rapper.
November 24th, 2010 at 9:47 PM ^
Dude can straight flow. Absolute STUD. Smooth as hell. Makes all the sense in the world that he would be Charles' favorite.
November 24th, 2010 at 9:45 PM ^
They appear to be placed on the high point of each trend, but its hard to tell by looking. All of the Michigan stats are hidden by that obnoxious color. Is there anyway you can post this as 2 line graphs, or better yet an excel sheet? This stat needs a moving average for both teams.